using chimera to display tomography map

Hello, Happy 2020! We are doing tomography reconstruction of retrovirus assemblies. Because the raw tomograms are very noisy, they can not be represented nicely using isosurfaces. I see other researchers in the field presented the tomo map in Chimera by superimposing subtomogram-averaged map onto the original tomogram according to the subunit's locations and relative orientations. The color of the displayed subunits is based on the correlation coefficient between the averaged subunit map and the original density of the tomogram. One example is Fig.1B in this paper: https://advances.sciencemag.org/content/5/11/eaaw3631 We do use the program Dynamo for the subtomogram averaging procedure, so our data format is very similar to what was used in this paper. Is this feature is part of Chimera? Could we obtain the extended software? Or is this customer built and we need to contact the authors of the paper? Or shall we work out this procedure by ourselves with the help of Chimera experts? Thank you, Wei

Hi Wei, Happy 2020! Chimera has a “vop localCorrelation” command that given two maps, creates a new map that is the local correlation (using a sliding box, for which the user can specify the box size). Then the local-correlation map values can be used to color the isosurface of another map using the “Surface Color” tool or “scolor” command, and also show a color key. <http://www.rbvi.ucsf.edu/chimera/docs/UsersGuide/midas/vop.html#localCorrela...> <http://www.rbvi.ucsf.edu/chimera/docs/ContributedSoftware/surfcolor/surfcolo...> <http://www.rbvi.ucsf.edu/chimera/docs/UsersGuide/midas/scolor.html> ChimeraX also has these features, as commands “volume localCorrelation” and “color sample”, but cannot yet draw the color key. <http://rbvi.ucsf.edu/chimerax/docs/user/commands/volume.html#localCorrelatio...> <http://rbvi.ucsf.edu/chimerax/docs/user/commands/color.html#map> I hope this helps, Best, Elaine ----- Elaine C. Meng, Ph.D. UCSF Chimera(X) team Department of Pharmaceutical Chemistry University of California, San Francisco
On Jan 1, 2020, at 8:40 AM, Wei Zhang <zhangwei@umn.edu> wrote:
Hello, Happy 2020!
We are doing tomography reconstruction of retrovirus assemblies. Because the raw tomograms are very noisy, they can not be represented nicely using isosurfaces. I see other researchers in the field presented the tomo map in Chimera by superimposing subtomogram-averaged map onto the original tomogram according to the subunit's locations and relative orientations. The color of the displayed subunits is based on the correlation coefficient between the averaged subunit map and the original density of the tomogram.
One example is Fig.1B in this paper: https://advances.sciencemag.org/content/5/11/eaaw3631
We do use the program Dynamo for the subtomogram averaging procedure, so our data format is very similar to what was used in this paper. Is this feature is part of Chimera? Could we obtain the extended software? Or is this customer built and we need to contact the authors of the paper? Or shall we work out this procedure by ourselves with the help of Chimera experts?
Thank you, Wei
Elanie, These functions are very very useful. Thank you. I believe we can take advantage of these built-in functions in our procedures. I have a follow-up question. If I have map (in mrc format), I wish to display it in Chimera at specific x, y, z position and at a certain Eular angle. How can I do it? I can think of two ways: (1) Modify the header of the map to include the position and orientation of the map, so Chimera can read and display it accordingly (2) Have a special text file that include those information and have Chimera display it Is there a better way to do it? Thanks so much! Wei On Thu, Jan 2, 2020 at 11:56 AM Elaine Meng <meng@cgl.ucsf.edu> wrote:
Hi Wei, Happy 2020!
Chimera has a “vop localCorrelation” command that given two maps, creates a new map that is the local correlation (using a sliding box, for which the user can specify the box size). Then the local-correlation map values can be used to color the isosurface of another map using the “Surface Color” tool or “scolor” command, and also show a color key. < http://www.rbvi.ucsf.edu/chimera/docs/UsersGuide/midas/vop.html#localCorrela...
< http://www.rbvi.ucsf.edu/chimera/docs/ContributedSoftware/surfcolor/surfcolo...
<http://www.rbvi.ucsf.edu/chimera/docs/UsersGuide/midas/scolor.html>
ChimeraX also has these features, as commands “volume localCorrelation” and “color sample”, but cannot yet draw the color key. < http://rbvi.ucsf.edu/chimerax/docs/user/commands/volume.html#localCorrelatio...
<http://rbvi.ucsf.edu/chimerax/docs/user/commands/color.html#map>
I hope this helps, Best, Elaine ----- Elaine C. Meng, Ph.D. UCSF Chimera(X) team Department of Pharmaceutical Chemistry University of California, San Francisco
On Jan 1, 2020, at 8:40 AM, Wei Zhang <zhangwei@umn.edu> wrote:
Hello, Happy 2020!
We are doing tomography reconstruction of retrovirus assemblies. Because the raw tomograms are very noisy, they can not be represented nicely using isosurfaces. I see other researchers in the field presented the tomo map in Chimera by superimposing subtomogram-averaged map onto the original tomogram according to the subunit's locations and relative orientations. The color of the displayed subunits is based on the correlation coefficient between the averaged subunit map and the original density of the tomogram.
One example is Fig.1B in this paper: https://advances.sciencemag.org/content/5/11/eaaw3631
We do use the program Dynamo for the subtomogram averaging procedure, so our data format is very similar to what was used in this paper. Is this feature is part of Chimera? Could we obtain the extended software? Or is this customer built and we need to contact the authors of the paper? Or shall we work out this procedure by ourselves with the help of Chimera experts?
Thank you, Wei
Hi Wei, As I understand it, an MRC map header does not contain orientation (rotations), so if you were trying to make a modified file you would instead have to resample it on another grid, as discussed here in the bottom section of the page: <http://www.rbvi.ucsf.edu/chimera/docs/UsersGuide/savemodel.html#afterfitting> The Transform Coordinates tool (in menu under Tools… Movement) allows you to apply a shift and Euler angles. However, there is no command to do it. It probably could be done with Python but somebody else would have to advise on that. <http://www.rbvi.ucsf.edu/chimera/docs/ContributedSoftware/transform/transfor...> I hope this helps, Elaine
On Jan 2, 2020, at 10:08 AM, Wei Zhang <zhangwei@umn.edu> wrote:
Elanie,
These functions are very very useful. Thank you. I believe we can take advantage of these built-in functions in our procedures.
I have a follow-up question. If I have map (in mrc format), I wish to display it in Chimera at specific x, y, z position and at a certain Eular angle. How can I do it? I can think of two ways: (1) Modify the header of the map to include the position and orientation of the map, so Chimera can read and display it accordingly (2) Have a special text file that include those information and have Chimera display it
Is there a better way to do it?
Thanks so much!
Wei
On Thu, Jan 2, 2020 at 11:56 AM Elaine Meng <meng@cgl.ucsf.edu> wrote: Hi Wei, Happy 2020!
Chimera has a “vop localCorrelation” command that given two maps, creates a new map that is the local correlation (using a sliding box, for which the user can specify the box size). Then the local-correlation map values can be used to color the isosurface of another map using the “Surface Color” tool or “scolor” command, and also show a color key. <http://www.rbvi.ucsf.edu/chimera/docs/UsersGuide/midas/vop.html#localCorrela...> <http://www.rbvi.ucsf.edu/chimera/docs/ContributedSoftware/surfcolor/surfcolo...> <http://www.rbvi.ucsf.edu/chimera/docs/UsersGuide/midas/scolor.html>
ChimeraX also has these features, as commands “volume localCorrelation” and “color sample”, but cannot yet draw the color key. <http://rbvi.ucsf.edu/chimerax/docs/user/commands/volume.html#localCorrelatio...> <http://rbvi.ucsf.edu/chimerax/docs/user/commands/color.html#map>
I hope this helps, Best, Elaine ----- Elaine C. Meng, Ph.D. UCSF Chimera(X) team Department of Pharmaceutical Chemistry University of California, San Francisco
On Jan 1, 2020, at 8:40 AM, Wei Zhang <zhangwei@umn.edu> wrote:
Hello, Happy 2020!
We are doing tomography reconstruction of retrovirus assemblies. Because the raw tomograms are very noisy, they can not be represented nicely using isosurfaces. I see other researchers in the field presented the tomo map in Chimera by superimposing subtomogram-averaged map onto the original tomogram according to the subunit's locations and relative orientations. The color of the displayed subunits is based on the correlation coefficient between the averaged subunit map and the original density of the tomogram.
One example is Fig.1B in this paper: https://advances.sciencemag.org/content/5/11/eaaw3631
We do use the program Dynamo for the subtomogram averaging procedure, so our data format is very similar to what was used in this paper. Is this feature is part of Chimera? Could we obtain the extended software? Or is this customer built and we need to contact the authors of the paper? Or shall we work out this procedure by ourselves with the help of Chimera experts?
Thank you, Wei

Hi Wei, If you placed the copies of the subtomogram average, you could then use the Chimera "vop add" command to add them all together (or maybe better to use "vop maximum" so that the overlaps between two copies don't create double density) making a single map. Then the "vop localCorrelation" command could compute the correlation between this assembled map and the original tomogram and color according to that correlation using the Chimera "Surface Color" tools to color by volume data value (using the local correlation map as the value). Chimera does almost nothing with Euler angles, and there are different Euler angle conventions you would need to worry about. You would be better off if you had a 3x3 rotation matrix. There is some Euler angle example of rotating a map and resampling it in the Chimera Python scripts web page but that seems like a hard approach. http://plato.cgl.ucsf.edu/trac/chimera/attachment/wiki/Scripts/eulermove.py Tom
On Jan 2, 2020, at 10:08 AM, Wei Zhang <zhangwei@umn.edu> wrote:
Elanie,
These functions are very very useful. Thank you. I believe we can take advantage of these built-in functions in our procedures.
I have a follow-up question. If I have map (in mrc format), I wish to display it in Chimera at specific x, y, z position and at a certain Eular angle. How can I do it? I can think of two ways: (1) Modify the header of the map to include the position and orientation of the map, so Chimera can read and display it accordingly (2) Have a special text file that include those information and have Chimera display it
Is there a better way to do it?
Thanks so much!
Wei
On Thu, Jan 2, 2020 at 11:56 AM Elaine Meng <meng@cgl.ucsf.edu <mailto:meng@cgl.ucsf.edu>> wrote: Hi Wei, Happy 2020!
Chimera has a “vop localCorrelation” command that given two maps, creates a new map that is the local correlation (using a sliding box, for which the user can specify the box size). Then the local-correlation map values can be used to color the isosurface of another map using the “Surface Color” tool or “scolor” command, and also show a color key. <http://www.rbvi.ucsf.edu/chimera/docs/UsersGuide/midas/vop.html#localCorrela... <http://www.rbvi.ucsf.edu/chimera/docs/UsersGuide/midas/vop.html#localCorrelation>> <http://www.rbvi.ucsf.edu/chimera/docs/ContributedSoftware/surfcolor/surfcolo... <http://www.rbvi.ucsf.edu/chimera/docs/ContributedSoftware/surfcolor/surfcolor.html>> <http://www.rbvi.ucsf.edu/chimera/docs/UsersGuide/midas/scolor.html <http://www.rbvi.ucsf.edu/chimera/docs/UsersGuide/midas/scolor.html>>
ChimeraX also has these features, as commands “volume localCorrelation” and “color sample”, but cannot yet draw the color key. <http://rbvi.ucsf.edu/chimerax/docs/user/commands/volume.html#localCorrelatio... <http://rbvi.ucsf.edu/chimerax/docs/user/commands/volume.html#localCorrelation>> <http://rbvi.ucsf.edu/chimerax/docs/user/commands/color.html#map <http://rbvi.ucsf.edu/chimerax/docs/user/commands/color.html#map>>
I hope this helps, Best, Elaine ----- Elaine C. Meng, Ph.D. UCSF Chimera(X) team Department of Pharmaceutical Chemistry University of California, San Francisco
On Jan 1, 2020, at 8:40 AM, Wei Zhang <zhangwei@umn.edu <mailto:zhangwei@umn.edu>> wrote:
Hello, Happy 2020!
We are doing tomography reconstruction of retrovirus assemblies. Because the raw tomograms are very noisy, they can not be represented nicely using isosurfaces. I see other researchers in the field presented the tomo map in Chimera by superimposing subtomogram-averaged map onto the original tomogram according to the subunit's locations and relative orientations. The color of the displayed subunits is based on the correlation coefficient between the averaged subunit map and the original density of the tomogram.
One example is Fig.1B in this paper: https://advances.sciencemag.org/content/5/11/eaaw3631 <https://advances.sciencemag.org/content/5/11/eaaw3631>
We do use the program Dynamo for the subtomogram averaging procedure, so our data format is very similar to what was used in this paper. Is this feature is part of Chimera? Could we obtain the extended software? Or is this customer built and we need to contact the authors of the paper? Or shall we work out this procedure by ourselves with the help of Chimera experts?
Thank you, Wei
_______________________________________________ Chimera-dev mailing list Chimera-dev@cgl.ucsf.edu http://plato.cgl.ucsf.edu/mailman/listinfo/chimera-dev
Dear Elaine and Tom, Thanks so much for the clarification and detailed information with the links of the python scripts. The algorithm becomes more refined. I will work though your emails step by step. although there is a learning curve. I understand euler angle can be painful to work with sometimes, thanks for suggesting to convert them into a 3 by 3 rotation matrix. I will see how to do it. Best regards, Wei On Thu, Jan 2, 2020 at 3:14 PM Tom Goddard <goddard@sonic.net> wrote:
Hi Wei,
If you placed the copies of the subtomogram average, you could then use the Chimera "vop add" command to add them all together (or maybe better to use "vop maximum" so that the overlaps between two copies don't create double density) making a single map. Then the "vop localCorrelation" command could compute the correlation between this assembled map and the original tomogram and color according to that correlation using the Chimera "Surface Color" tools to color by volume data value (using the local correlation map as the value).
Chimera does almost nothing with Euler angles, and there are different Euler angle conventions you would need to worry about. You would be better off if you had a 3x3 rotation matrix. There is some Euler angle example of rotating a map and resampling it in the Chimera Python scripts web page but that seems like a hard approach.
http://plato.cgl.ucsf.edu/trac/chimera/attachment/wiki/Scripts/eulermove.py
Tom
On Jan 2, 2020, at 10:08 AM, Wei Zhang <zhangwei@umn.edu> wrote:
Elanie,
These functions are very very useful. Thank you. I believe we can take advantage of these built-in functions in our procedures.
I have a follow-up question. If I have map (in mrc format), I wish to display it in Chimera at specific x, y, z position and at a certain Eular angle. How can I do it? I can think of two ways: (1) Modify the header of the map to include the position and orientation of the map, so Chimera can read and display it accordingly (2) Have a special text file that include those information and have Chimera display it
Is there a better way to do it?
Thanks so much!
Wei
On Thu, Jan 2, 2020 at 11:56 AM Elaine Meng <meng@cgl.ucsf.edu> wrote:
Hi Wei, Happy 2020!
Chimera has a “vop localCorrelation” command that given two maps, creates a new map that is the local correlation (using a sliding box, for which the user can specify the box size). Then the local-correlation map values can be used to color the isosurface of another map using the “Surface Color” tool or “scolor” command, and also show a color key. < http://www.rbvi.ucsf.edu/chimera/docs/UsersGuide/midas/vop.html#localCorrela...
< http://www.rbvi.ucsf.edu/chimera/docs/ContributedSoftware/surfcolor/surfcolo...
<http://www.rbvi.ucsf.edu/chimera/docs/UsersGuide/midas/scolor.html>
ChimeraX also has these features, as commands “volume localCorrelation” and “color sample”, but cannot yet draw the color key. < http://rbvi.ucsf.edu/chimerax/docs/user/commands/volume.html#localCorrelatio...
<http://rbvi.ucsf.edu/chimerax/docs/user/commands/color.html#map>
I hope this helps, Best, Elaine ----- Elaine C. Meng, Ph.D. UCSF Chimera(X) team Department of Pharmaceutical Chemistry University of California, San Francisco
On Jan 1, 2020, at 8:40 AM, Wei Zhang <zhangwei@umn.edu> wrote:
Hello, Happy 2020!
We are doing tomography reconstruction of retrovirus assemblies. Because the raw tomograms are very noisy, they can not be represented nicely using isosurfaces. I see other researchers in the field presented the tomo map in Chimera by superimposing subtomogram-averaged map onto the original tomogram according to the subunit's locations and relative orientations. The color of the displayed subunits is based on the correlation coefficient between the averaged subunit map and the original density of the tomogram.
One example is Fig.1B in this paper: https://advances.sciencemag.org/content/5/11/eaaw3631
We do use the program Dynamo for the subtomogram averaging procedure, so our data format is very similar to what was used in this paper. Is this feature is part of Chimera? Could we obtain the extended software? Or is this customer built and we need to contact the authors of the paper? Or shall we work out this procedure by ourselves with the help of Chimera experts?
Thank you, Wei
_______________________________________________ Chimera-dev mailing list Chimera-dev@cgl.ucsf.edu http://plato.cgl.ucsf.edu/mailman/listinfo/chimera-dev
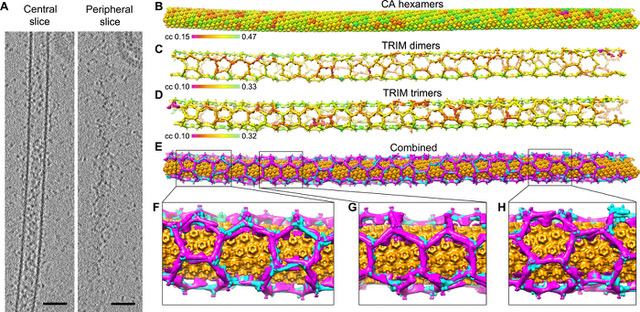
Hi Wei, It looks to me that figure 1B of the HIV TRIM5alpha paper (attached below) has about 1000 copies of the subtomogram averaged hexamer placed to make the filament. You can see in figure 1F, 1G, 1H a magnified version where the seams between the different hexamers are visible. There are some Python scripts for Chimera to place copies of a map at specific positions given by a rotation matrix and translation. These scripts are on the Chimera Python scripts web page http://plato.cgl.ucsf.edu/trac/chimera/wiki/Scripts <http://plato.cgl.ucsf.edu/trac/chimera/wiki/Scripts> one is called "place.py" and another that works with IMOD placements is called "placeimod.py" http://plato.cgl.ucsf.edu/trac/chimera/attachment/wiki/Scripts/place.py http://plato.cgl.ucsf.edu/trac/chimera/attachment/wiki/Scripts/placeimod.py <http://plato.cgl.ucsf.edu/trac/chimera/attachment/wiki/Scripts/placeimod.py> There are also scripts to place molecular models at each position. I just searched for "copies" on that Chimera scripts web page to find these. For coloring the copies by their correlation with the tomogram you could use the Chimera "measure correlation" command once for each placed copy https://www.cgl.ucsf.edu/chimera/docs/UsersGuide/midas/measure.html#correlat... You could make use of the perframe command to measure these all in one command or you could make a command file or Python script that ran all those commands. Then how do you color using correlation? There is a Chimera Render by Attribute too and rangecolor command that can color molecules by an attribute value but those don't work on maps. So I guess my best suggestion for that would be to use a Python script that loops over the placed copies, computes their correlation, then colors them. I can help with that script if you want to try it. Another thought is to ask the authors of the HIV TRIM5alpha paper how they did it. Tom
On Jan 1, 2020, at 8:40 AM, Wei Zhang <zhangwei@umn.edu> wrote:
Hello,
Happy 2020!
We are doing tomography reconstruction of retrovirus assemblies. Because the raw tomograms are very noisy, they can not be represented nicely using isosurfaces. I see other researchers in the field presented the tomo map in Chimera by superimposing subtomogram-averaged map onto the original tomogram according to the subunit's locations and relative orientations. The color of the displayed subunits is based on the correlation coefficient between the averaged subunit map and the original density of the tomogram.
One example is Fig.1B in this paper: https://advances.sciencemag.org/content/5/11/eaaw3631 <https://advances.sciencemag.org/content/5/11/eaaw3631>
We do use the program Dynamo for the subtomogram averaging procedure, so our data format is very similar to what was used in this paper. Is this feature is part of Chimera? Could we obtain the extended software? Or is this customer built and we need to contact the authors of the paper? Or shall we work out this procedure by ourselves with the help of Chimera experts?
Thank you,
Wei _______________________________________________ Chimera-dev mailing list Chimera-dev@cgl.ucsf.edu http://plato.cgl.ucsf.edu/mailman/listinfo/chimera-dev
participants (3)
-
 Elaine Meng
 -
 Tom Goddard
 -
 Wei Zhang