
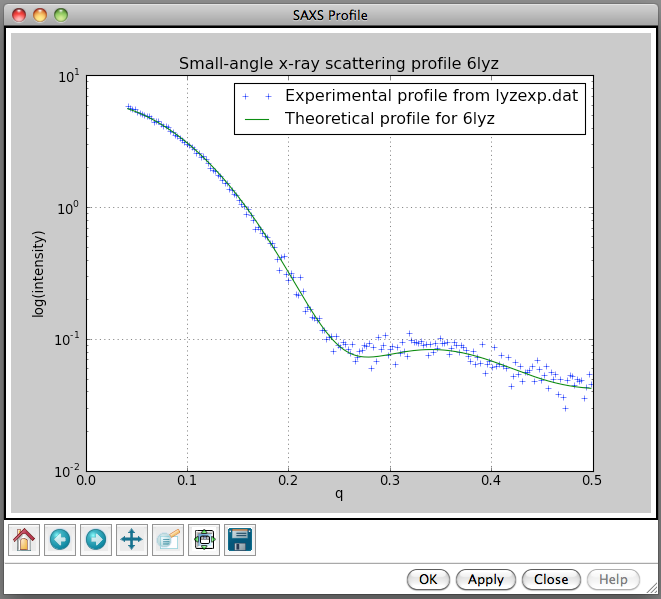
Hi Alex, I'll give em2dam a try. I agree it would be useful for comparing EM and SAXS data. For NMR models I think it would be useful to generate SAXS profiles for each conformer and see which fit the experimental data the best. Probably could plot profiles for 20 conformers on one plot to get an idea of the degree of variation. Sometimes the NMR conformers indicate flexibility in solution and maybe some combination of them could provide a good fit to the SAXS data in that case. But other times, the variation among conformers is just due to lack of NMR constraints and is not due to flexibility in solution. There is a strong risk of over-fitting if multiple NMR conformers are used to fit SAXS data. Not sure why your test of the Chimera SAXS profile calculation did not work well for lyzosome. I've attached two images using Chimera daily build 31662 (Oct 17) where it worked fine for lyzosome with the experimental profile I have. Maybe the minimum q = 0.2 is related to your experimental profile not having small q values? YZ in our lab works on the Chimera SAXS tool and could give a better answer. Tom
Hi Tom
Dummy atoms are placed according to pixel size. The only documentation is available from "em2dam -help". You can get example mentioned in help from EMDB.
I am sending you linux binary. We are not using macs here much. I hope this is not a problem. In attachment is a test version. There are some bugs I work on at the moment, but feedback is very welcome.
It is very interesting, because I developed last version of CRYSOL (2.7). I never used FOXS though. What you plan to do is actually validating high resolution models (NMR or Xray). Actually how would you treat NMR models? Often I see that not low energy (first conformer), but other models fit SAXS data better, or even their combination. Plausible addition to it would be validation of EM models by first generating dummy models and then calculating theoretical curve and fitting to experimental data.
http://www.cgl.ucsf.edu/chimera/docs/ContributedSoftware/saxs/saxs.htm l
I am actually using alpha version 1.5 (build 31455). I tried a simple test, namely, loaded lysozyme and fit it to experimental data. The fit is very bad! and why q is plotted starting from 0.2?
Kind regards Alex
On Saturday 16 October 2010 01:26:50 you wrote:
Hi Alexander,
I have talked to someone (forgot name, at Grenoble EM fitting workshop a year ago) who was interested in computing SAXS profiles for EM blobs of unknown proteins and your EM2DAM program could make that possible. It might also have utility in analyzing EM maps. I wonder about details like how how far apart are the dummy atoms placed. Is documentation for the program available?
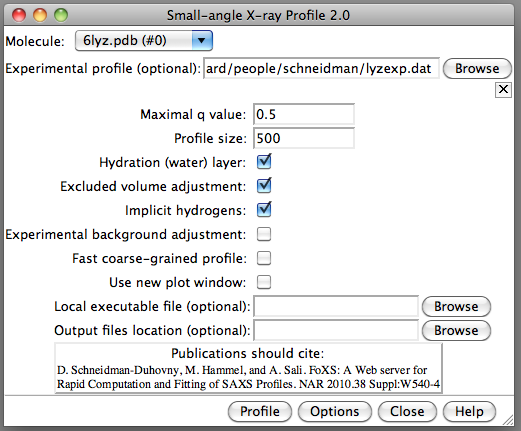
About 9 months ago I added to Chimera the ability to compute a SAXS profile from an atomic model which is then plotted against an experimental profile. The idea is that you could test various atomic model conformations to see which is most compatible with SAXS data. Since then YZ in our lab has added new options and made it work using a web service in addition to the option of running a local program. This is in Chimera daily builds but not in the 1 year old Chimera 1.4 production release. We will have a Chimera 1.5 release soon that will have it. It uses FoXS (http://modbase.compbio.ucsf.edu/foxs/about.html) for the profile computation. Here's a description from the Chimera User's Guide of the Chimera user interface.
http://www.cgl.ucsf.edu/chimera/docs/ContributedSoftware/saxs/saxs.htm l
Tom
_______________________________________________ Chimera-users mailing list Chimera-users@cgl.ucsf.edu http://plato.cgl.ucsf.edu/mailman/listinfo/chimera-users