
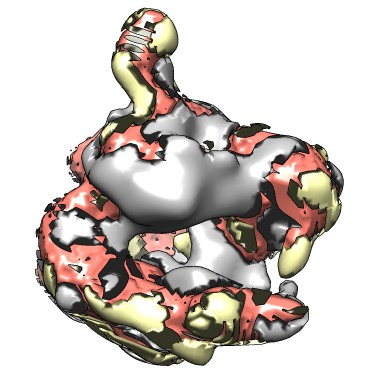
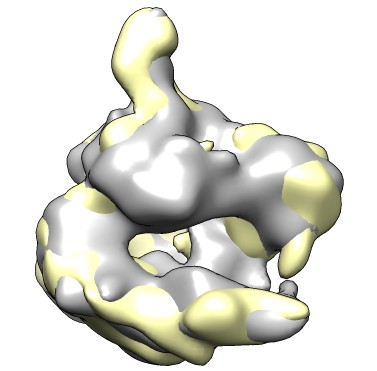
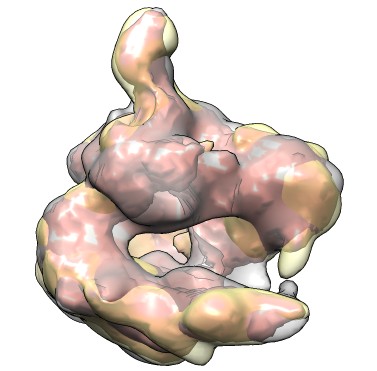
Hi Terry, Here's an example although the result isn't pretty. open emdbID:1283 emdbID:1284 volume #0,1 level .35 mask #0 #1 invert true mask #1 #0 invert true mask #0 #1 volume #4 color salmon An image of the result is attached vdiff.jpg with gray for parts in map A and not map B, yellow for parts in B and not in A, and red for parts in both. Here's an explanation of the commands. The first two just open the maps and set the contour level. The first mask command produces a new volume equal to map A but with zeros at grid points inside the surface of map B. The second mask command produces a volume equal to B except 0 inside the surface of A. The third mask command makes a map equal to A but zero outside the surface of B. So these new maps are (A not B), (B not A) and (A and B) and are shown as gray, yellow, and red surfaces in vdiff.jpg. Why does it look so jagged? That is the result of setting a map to zero above a threshold and then showing a contour surface at that threshold. It produces a horrible jagged surface because of the saw-tooth patterns of the zeros and non-zeros at the boundary. If we could make the grid spacing go to zero the picture would instead look like the second attached image vsup.jpg. This is just the two original map surfaces. Notice there is no red (points in side both A and B). At every point on the two surfaces either one surface or the other is on top. So the only place you see both A and B is on the curved lines where the two surfaces intersect. The reason you see a lot of red with the above commands is because the grid spacing is actually larger than the separation between the two map surfaces at many points. It is basically an artifact of discretization. So to see all 3 components (A not B), (B not A) and (A and B) you'd need to make the first two components transparent. I've done that in the third attached image vtransp.jpg. It shows the original two maps transparent and the (A and B) red map opaque. This uses Chimera 1.6 where the default transparency mode is "one transparent layer" so only the gray or yellow top-most transparent layer is shown. Still it looks like a mess. I haven't followed your plan #1 or #2 in detail. Note that you would need a resulting map with 4 distinct values not 3, with the 4th being points outside both maps. My main point is that it is hard to make a useful 3-d Venn diagram since the (A and B) component will be occluded by (A not B) and (B not A). If the red surface in the last image were smooth it would be a bit better but still hard to visually comprehend. I have a way to make the red surface smooth (basically just show the part of surface A that lies inside B and part of surface B that lies inside A using original smooth surfaces) but it is not accessible from the Chimera user interface. Tom
Hey Guys,
I am interested in making kind of a ven diagram between two maps for electron density (see attached). What I would like to do is where the density is above a certain threshold for both maps, color the map grey, and where it is above the threshold for map A only, color red, and for map B only, blue.
Plan #1 --superimpose maps (have this working) --create a third map (have this working) --do a direct < > = point-by-point comparison between map A and B and reset the values of the third map to be -1 (map A only), 0 (both maps) or 1 (map B only) --color the map using the histograms PROBLEM: The maps are not gridded the same. After some careful thought, I don't think I actually can get them gridded the same for technical reasons.
Plan #2 --superimpose maps (have this working) --create copy of map A (coarser map) with map A gridding (have this working) --use interpolation function to interpolate map B (finer map) onto map A gridding --create copy of map A and do a direct < > = point-by-point comparison between map A and interpolated map B and reset the values of the fourth map to be -1 (map A only), 0 (both maps) or 1 (map B only) --color the map using the histograms QUESTION: Is there an easier way to do this with tools that already exist in Chimera? If not, can I get a little bit of info on how the data is stored in the ccp4 style maps (eg start at origin and loop over x, loop over y, loop over z or something else?)
Let me know if you need more details or clarification on this rats nest.
Thanks! Terry
_______________________________________________ Chimera-users mailing list Chimera-users@cgl.ucsf.edu http://plato.cgl.ucsf.edu/mailman/listinfo/chimera-users