
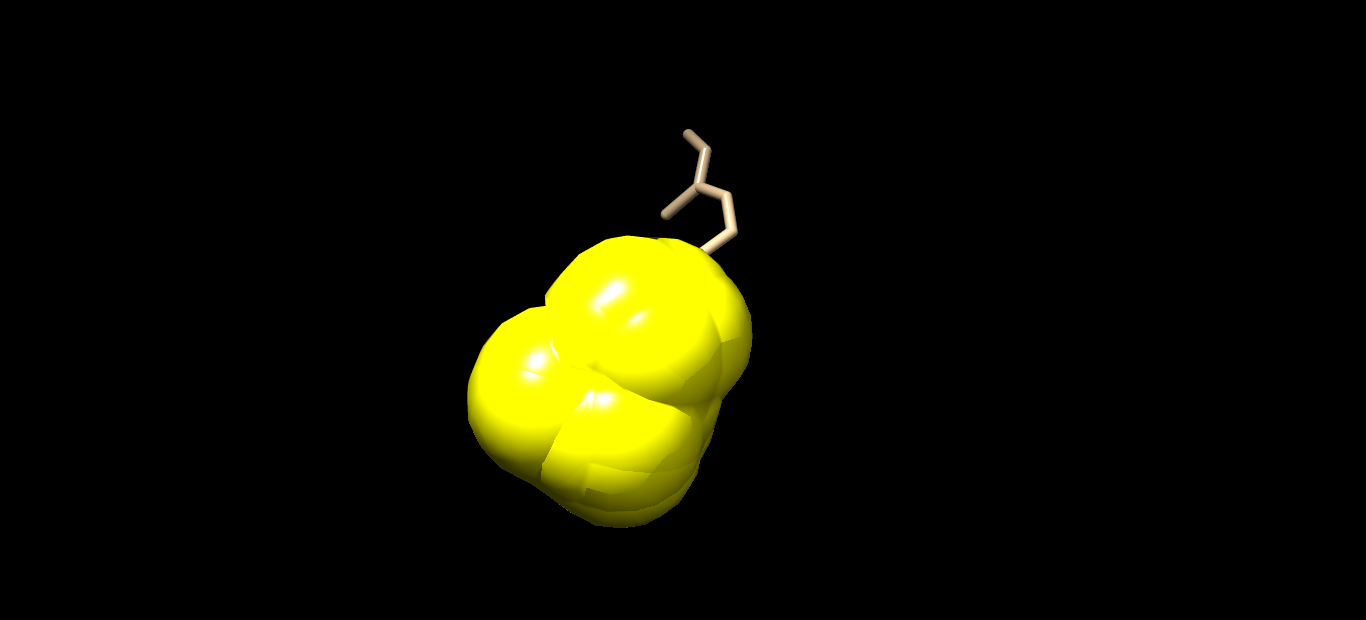
Hi Elaine, Sorry to bother you again. I tried to generate a similar figure for the PDB id: 1U19. I am interested in showing the surface around the ligand Retinal which is covalently bound to rhodopsin. The surface shown here looks a bit weird. Kindly check the attachment. Only part of the surface around the ligand is shown. Moreover the cavity remains closed. I don't know how to adjust the parameters. I tried many options. But I couldn't extend the contact area so that it covers the whole ligand. Are there any options to do the same for apo structures? Thanks, vigneshwari On Sat, Nov 9, 2013 at 6:09 PM, Elaine Meng <meng@cgl.ucsf.edu> wrote:
Hi Vigneshwari, You can see the manual page by using command "help measure" or you can see it on our website here:
<http://www.rbvi.ucsf.edu/chimera/docs/UsersGuide/midas/measure.html> < http://www.rbvi.ucsf.edu/chimera/docs/UsersGuide/midas/measure.html#contactA...
Best, Elaine ----- Elaine C. Meng, Ph.D. UCSF Computer Graphics Lab (Chimera team) and Babbitt Lab Department of Pharmaceutical Chemistry University of California, San Francisco
On Nov 9, 2013, at 3:31 AM, vigneshwari subramanian wrote:
Hi Elaine,
Thank you so much for your timely help. I could actually make the same figure. I need to do the same for our dataset.
It would be really helpful if you can tell me what each of these parameters mean. I think you gave an overview. But I would like to know what each of these mean.
3 slab -.1,0
measure contactArea #0.2 #0.1 3 slab -.1,0 color tan measure contactArea #0.2 #0.1 2.99 slab -.11,-.01 color cornflowerblue
I checked the manual. But I couldn't find any information about measure contactArea.
I am there in the chimera list.
regards, vigneshwari