
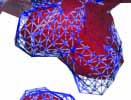
Hey Guys, I am interested in making kind of a ven diagram between two maps for electron density (see attached). What I would like to do is where the density is above a certain threshold for both maps, color the map grey, and where it is above the threshold for map A only, color red, and for map B only, blue. Plan #1 --superimpose maps (have this working) --create a third map (have this working) --do a direct < > = point-by-point comparison between map A and B and reset the values of the third map to be -1 (map A only), 0 (both maps) or 1 (map B only) --color the map using the histograms PROBLEM: The maps are not gridded the same. After some careful thought, I don't think I actually can get them gridded the same for technical reasons. Plan #2 --superimpose maps (have this working) --create copy of map A (coarser map) with map A gridding (have this working) --use interpolation function to interpolate map B (finer map) onto map A gridding --create copy of map A and do a direct < > = point-by-point comparison between map A and interpolated map B and reset the values of the fourth map to be -1 (map A only), 0 (both maps) or 1 (map B only) --color the map using the histograms QUESTION: Is there an easier way to do this with tools that already exist in Chimera? If not, can I get a little bit of info on how the data is stored in the ccp4 style maps (eg start at origin and loop over x, loop over y, loop over z or something else?) Let me know if you need more details or clarification on this rats nest. Thanks! Terry -- Paula Therese Lang Postdoctoral Scholar Alber Lab UC Berkeley/QB3