
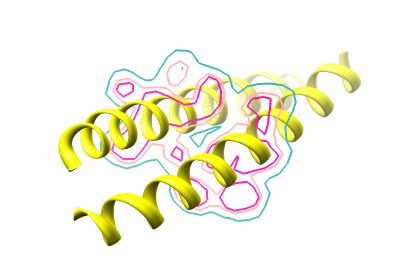
Hi, How can I get multi contour lines like attached figure? Thank you. Guizhen[cid:6F7E8CFD-DC43-4F29-B7D7-A2F7FE4A03D6@bcm.edu]

Hi Guizhen, I don’t know of a way to make a figure exactly like yours, with colors between black lines. However, I know how to show a slice in which the contour lines themselves are colored, as in the attached image. To make that image, I used the “Planes” feature in Volume Viewer, with multiple contour levels and other specific settings as described in this previous post: <http://plato.cgl.ucsf.edu/pipermail/chimera-users/2010-August/005454.html> I hope this helps, Elaine ----- Elaine C. Meng, Ph.D. UCSF Computer Graphics Lab (Chimera team) and Babbitt Lab Department of Pharmaceutical Chemistry University of California, San Francisco On Nov 5, 2014, at 7:41 AM, Fan, Guizhen <Guizhen.Fan@uth.tmc.edu> wrote:
Hi, How can I get multi contour lines like attached figure? Thank you. Guizhen
Thank you. Maybe they used different software. On Nov 5, 2014, at 12:36 PM, Elaine Meng <meng@cgl.ucsf.edu<mailto:meng@cgl.ucsf.edu>> wrote: Hi Guizhen, I don’t know of a way to make a figure exactly like yours, with colors between black lines. However, I know how to show a slice in which the contour lines themselves are colored, as in the attached image. To make that image, I used the “Planes” feature in Volume Viewer, with multiple contour levels and other specific settings as described in this previous post: <http://plato.cgl.ucsf.edu/pipermail/chimera-users/2010-August/005454.html<https://urldefense.proofpoint.com/v2/url?u=http-3A__plato.cgl.ucsf.edu_pipermail_chimera-2Dusers_2010-2DAugust_005454.html&d=AAMF-g&c=6vgNTiRn9_pqCD9hKx9JgXN1VapJQ8JVoF8oWH1AgfQ&r=vvWfCerKgBcFT5AiEGZk8dfN4IREth33--_K4BUjb1M&m=nxXHRo0BUosOoN0xJ92yQJpH41r8ugPxB0NJ7Y9F6Jk&s=j881gpx43i3go7IJSXGfnYtRJByzJLQSLD7xYdhJZIo&e=>> I hope this helps, Elaine ----- Elaine C. Meng, Ph.D. UCSF Computer Graphics Lab (Chimera team) and Babbitt Lab Department of Pharmaceutical Chemistry University of California, San Francisco <contourlines.png> On Nov 5, 2014, at 7:41 AM, Fan, Guizhen <Guizhen.Fan@uth.tmc.edu<https://urldefense.proofpoint.com/v2/url?u=http-3A__mailto-3AGuizhen.Fan-40uth.tmc.edu&d=AAMF-g&c=6vgNTiRn9_pqCD9hKx9JgXN1VapJQ8JVoF8oWH1AgfQ&r=vvWfCerKgBcFT5AiEGZk8dfN4IREth33--_K4BUjb1M&m=nxXHRo0BUosOoN0xJ92yQJpH41r8ugPxB0NJ7Y9F6Jk&s=hhNOrPZvx56riIyipS2_YieX9Nq43ucg35odtQB4unc&e=>> wrote: Hi, How can I get multi contour lines like attached figure? Thank you. Guizhen

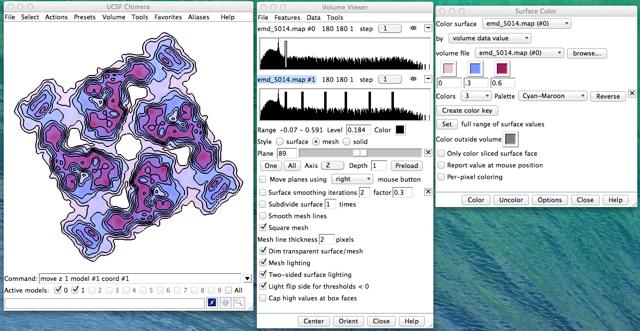
Hi Guizhen, Here are a few more details. This is kind of tricky because Chimera focuses on 3d images, not 2d plots. Use volume dialog menu Features / Planes to show one plane of your map, switch to surface style, use volume dialog menu Tools / Surface Color and color the plane by "volume data value”. Now we make the contour lines by making a copy of the map, volume dialog menu File / Duplicate, show the same plane, set style to Mesh, turn off the “Cap high values at box faces” option (Features / Surface and Mesh Options), add more contour levels using ctrl-click on the histogram, increase line thickness (Featues / Surface and Mesh Options), color all levels black (command "color black #1”). Since the planes are at exactly the same level the contour lines are probably hidden. To fix this move the contour plane slightly forward with command “move z 1 model #1 coord #1” (move map #1 by 1 Angstrom along the z direction of the coordinate system of map #1). I did this on a ryanodine receptor map, emdb 5014 (plane 89). Here’s the result. Tom On Nov 5, 2014, at 10:36 AM, Elaine Meng <meng@cgl.ucsf.edu> wrote:
Hi Guizhen, I don’t know of a way to make a figure exactly like yours, with colors between black lines. However, I know how to show a slice in which the contour lines themselves are colored, as in the attached image. To make that image, I used the “Planes” feature in Volume Viewer, with multiple contour levels and other specific settings as described in this previous post:
<http://plato.cgl.ucsf.edu/pipermail/chimera-users/2010-August/005454.html>
I hope this helps, Elaine ----- Elaine C. Meng, Ph.D. UCSF Computer Graphics Lab (Chimera team) and Babbitt Lab Department of Pharmaceutical Chemistry University of California, San Francisco
<contourlines.png> On Nov 5, 2014, at 7:41 AM, Fan, Guizhen <Guizhen.Fan@uth.tmc.edu> wrote:
Hi, How can I get multi contour lines like attached figure? Thank you. Guizhen
_______________________________________________ Chimera-users mailing list Chimera-users@cgl.ucsf.edu http://plato.cgl.ucsf.edu/mailman/listinfo/chimera-users
participants (3)
-
 Elaine Meng
 -
 Fan, Guizhen
 -
 Tom Goddard