
I am trying to visualize the graphic output from the Curves+ of a DNA duplex, which consists of two smooth backbone traces linked by vectors indicating the measured widths of the minor and major grooves. In the test case shown, adding two atoms defining one such vector and a single CONECT line linking them together (see attached PDB file) leads to three new bond vectors in the representation shown below. Am I making a mistake, or is this a problem with Chimera? Richard LAVERY richard.lavery@ibcp.fr http://web.mac.com/laveryr/Homepage Institut de Biologie et Chimie des Protéines 7 passage du Vercors, Lyon 69367, France Tel: +33 (0)4 72 72 26 37, Cell 06 62 76 84 47

On Dec 21, 2010, at 6:42 AM, Richard LAVERY wrote:
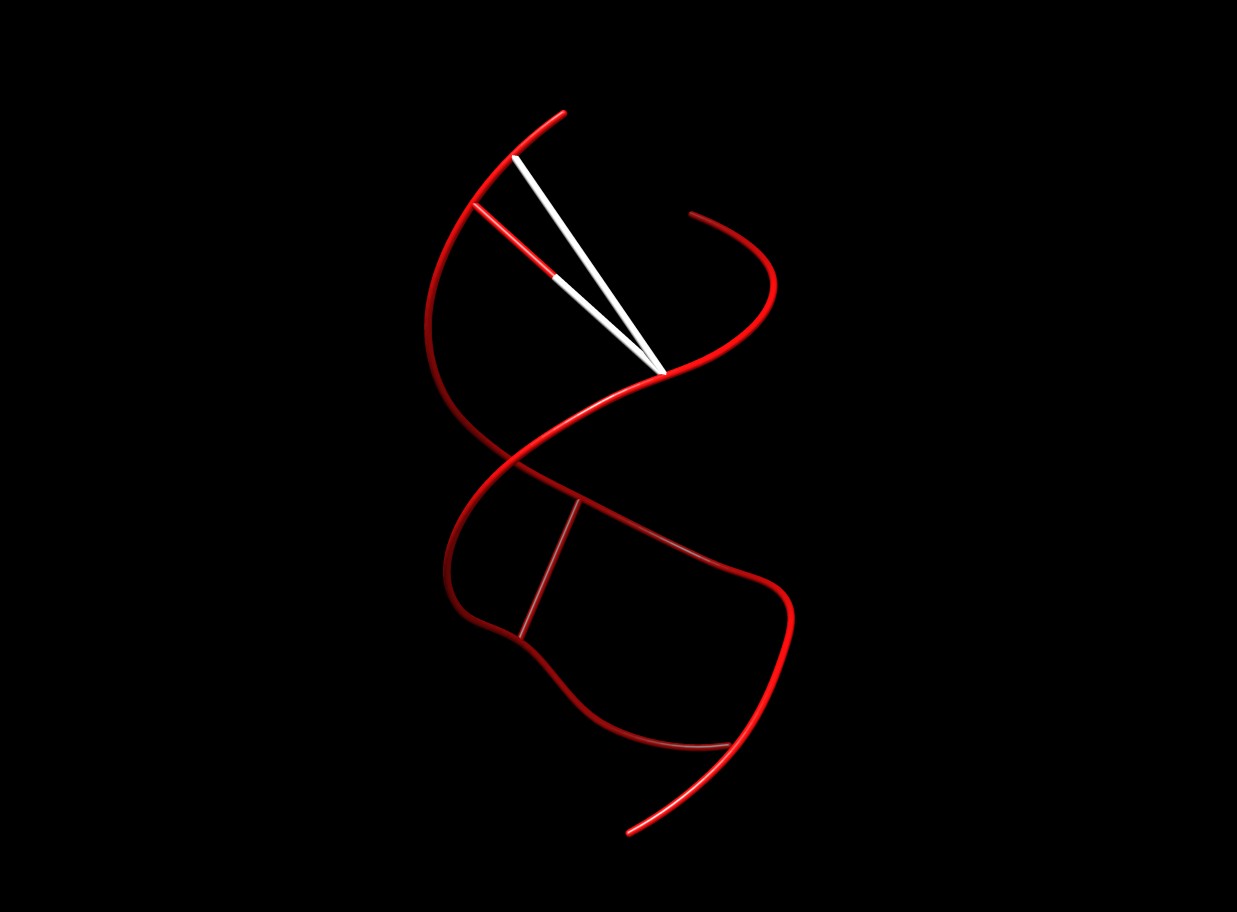
I am trying to visualize the graphic output from the Curves+ of a DNA duplex, which consists of two smooth backbone traces linked by vectors indicating the measured widths of the minor and major grooves. In the test case shown, adding two atoms defining one such vector and a single CONECT line linking them together (see attached PDB file) leads to three new bond vectors in the representation shown below. Am I making a mistake, or is this a problem with Chimera?
Hi Richard, The trick here is that Chimera will always connect consecutive residues contained in ATOM records unless there is an intervening TER record. That's where the two extra bonds are coming from: one between BACAD 1 and BACBD 2 and one between BACBD 2 and GRVAD 1. Ironically, the CONECT record you added was superfluous since Chimera would have automatically added a bond between GRVAD 1 and GRVAD 2! Your options to correct this are: 1) Add TER records between the residues 2) Use HETATM records instead of ATOM records. Chimera won't automatically join consecutive HETATM residues. --Eric Eric Pettersen UCSF Computer Graphics Lab

Hi Richard, It is a format problem -- compared to "standard" PDB, the discrepancies are that the residue names are too long, multiple atoms in the same residue have the same name, and the atom names (unless 4 characters) should start one column later. However, these are not why you are getting connections... there will be an attempt to connect atoms within the same residue (having the same residue number), as well as successive-in-the-file ATOM residues that are not separated by TER. I believe you will get the expected result by either changing "ATOM " to "HETATM" or by putting a TER between the residues (both alternatives attached). I hope this helps, Elaine ---------- Elaine C. Meng, Ph.D. UCSF Computer Graphics Lab (Chimera team) and Babbitt Lab Department of Pharmaceutical Chemistry University of California, San Francisco On Dec 21, 2010, at 6:42 AM, Richard LAVERY wrote:
I am trying to visualize the graphic output from the Curves+ of a DNA duplex, which consists of two smooth backbone traces linked by vectors indicating the measured widths of the minor and major grooves. In the test case shown, adding two atoms defining one such vector and a single CONECT line linking them together (see attached PDB file) leads to three new bond vectors in the representation shown below. Am I making a mistake, or is this a problem with Chimera?
Richard LAVERY richard.lavery@ibcp.fr http://web.mac.com/laveryr/Homepage
Institut de Biologie et Chimie des Protéines 7 passage du Vercors, Lyon 69367, France Tel: +33 (0)4 72 72 26 37, Cell 06 62 76 84 47
participants (3)
-
 Elaine Meng
 -
 Eric Pettersen
 -
 Richard LAVERY