
Dear User, I'll appreciate your help. I've worked with Chimera previously, but have not used it recently. Now I try to repeat some of the analysis I've done, but I don't see the option ,solvent accessible surface, in the software (I guess I've installed a newer version). I would like to color all the exposed (to the solvent) residues like in the image below and export a table with these values per atom and residue. [cid:7c648fa9-c7cf-4dab-bf40-f0b4a95b8f47] What I tried to do this time is : 1. Show a molecular surface.. 2. Depiction --> render by attr , when attr is set to areaSAS on residues [cid:f46b071c-36ab-4792-bfc2-31eb50fc2be3] The result I got was: [cid:6b44e796-b2c2-42f8-aac8-1ab725121d38] Am I doing it right? how can export the calculated areaSAS per atom and residue from chimera? How the SAS values calculated in Chimera? Does the higher value means that this residue is more exposed? Thank you for your help, Anastasia

HI Anastasia, It sounds like you figured this out already: Surface area (both SAS and SES) per atom and per residue is automatically calculated when you display a molecular surface. For any structure, if you can show the surface, you can see a histogram of the surface area values, color by those values, save them to a file, etc. using "Render by Attribute" (in menu under Tools… Structure Analysis). <http://www.rbvi.ucsf.edu/chimera/docs/ContributedSoftware/render/render.html> SES is what Chimera shows, although it gives values for both SAS and SES. An image here shows the difference: <http://www.rbvi.ucsf.edu/chimera/docs/UsersGuide/representation.html#surface...> Yes, the values are areas in square angstroms, so larger is more surface area of that atom or residue. The values are not normalized to % exposed, so bigger residues can have bigger values. The areas are calculated by MSMS, as mentioned in the link above. Yes, you are using the right process for coloring. The brownish colors are for the values between where you put red and green, so they are a mix of red and green. I usually avoid using red next to green, but of course you can use whatever colors you like. Use the File menu on the Render by Attribute dialog to save the values to a file. <http://www.rbvi.ucsf.edu/chimera/docs/ContributedSoftware/render/render.html...> To calculate normalized values (% exposure) it would be more complicated, but there are instructions here: <http://www.rbvi.ucsf.edu/chimera/docs/UsersGuide/surfnorm.html> I hope this helps, Elaine ----- Elaine C. Meng, Ph.D. UCSF Chimera(X) team Department of Pharmaceutical Chemistry University of California, San Francisco
On Oct 24, 2018, at 6:33 AM, anastasia@campus.technion.ac.il wrote:
Dear User,
I'll appreciate your help. I've worked with Chimera previously, but have not used it recently. Now I try to repeat some of the analysis I've done, but I don't see the option ,solvent accessible surface, in the software (I guess I've installed a newer version). I would like to color all the exposed (to the solvent) residues like in the image below and export a table with these values per atom and residue. <pastedImage.png>
What I tried to do this time is : • Show a molecular surface ..
• Depiction --> render by attr , when attr is set to areaSAS on
residues
<pastedImage.png>
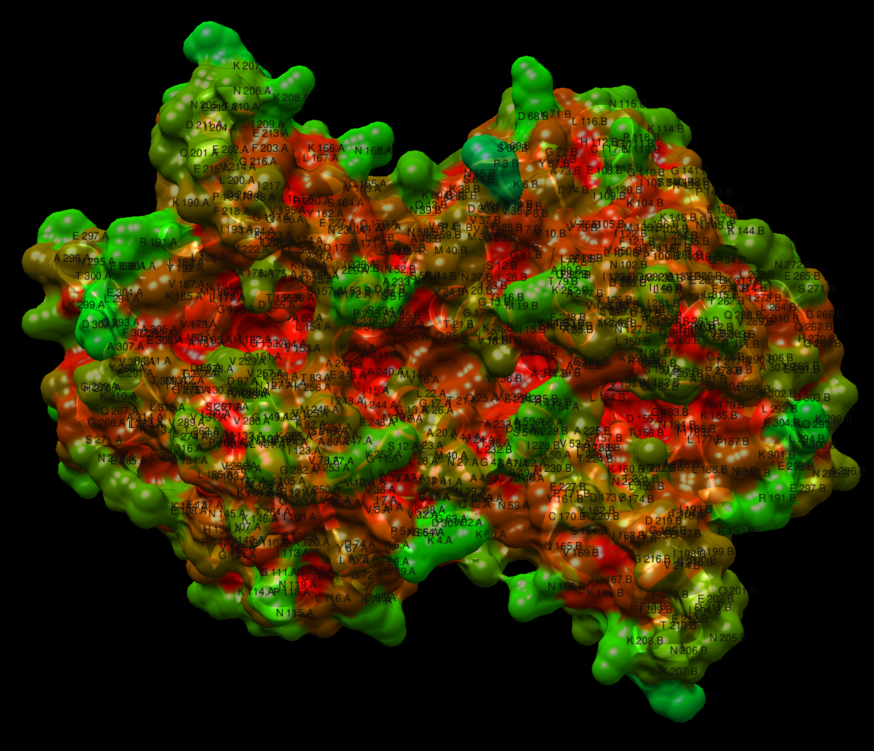
The result I got was:
<pastedImage.png>
Am I doing it right? how can export the calculated areaSAS per atom and residue from chimera?
How the SAS values calculated in Chimera? Does t he higher value means that this residue is more exposed?
Thank you for your help, Anastasia
Great ! Thank you for your valuable input. Best, Anastasia ________________________________ From: Elaine Meng <meng@cgl.ucsf.edu> Sent: Wednesday, October 24, 2018 6:25:00 PM To: Anastasia Shapiro Cc: chimera-users@cgl.ucsf.edu Subject: Re: [Chimera-users] Accessible surface area and ASA per residue HI Anastasia, It sounds like you figured this out already: Surface area (both SAS and SES) per atom and per residue is automatically calculated when you display a molecular surface. For any structure, if you can show the surface, you can see a histogram of the surface area values, color by those values, save them to a file, etc. using "Render by Attribute" (in menu under Tools… Structure Analysis). <http://www.rbvi.ucsf.edu/chimera/docs/ContributedSoftware/render/render.html> SES is what Chimera shows, although it gives values for both SAS and SES. An image here shows the difference: <http://www.rbvi.ucsf.edu/chimera/docs/UsersGuide/representation.html#surface...> Yes, the values are areas in square angstroms, so larger is more surface area of that atom or residue. The values are not normalized to % exposed, so bigger residues can have bigger values. The areas are calculated by MSMS, as mentioned in the link above. Yes, you are using the right process for coloring. The brownish colors are for the values between where you put red and green, so they are a mix of red and green. I usually avoid using red next to green, but of course you can use whatever colors you like. Use the File menu on the Render by Attribute dialog to save the values to a file. <http://www.rbvi.ucsf.edu/chimera/docs/ContributedSoftware/render/render.html...> To calculate normalized values (% exposure) it would be more complicated, but there are instructions here: <http://www.rbvi.ucsf.edu/chimera/docs/UsersGuide/surfnorm.html> I hope this helps, Elaine ----- Elaine C. Meng, Ph.D. UCSF Chimera(X) team Department of Pharmaceutical Chemistry University of California, San Francisco
On Oct 24, 2018, at 6:33 AM, anastasia@campus.technion.ac.il wrote:
Dear User,
I'll appreciate your help. I've worked with Chimera previously, but have not used it recently. Now I try to repeat some of the analysis I've done, but I don't see the option ,solvent accessible surface, in the software (I guess I've installed a newer version). I would like to color all the exposed (to the solvent) residues like in the image below and export a table with these values per atom and residue. <pastedImage.png>
What I tried to do this time is : • Show a molecular surface ..
• Depiction --> render by attr , when attr is set to areaSAS on
residues
<pastedImage.png>
The result I got was:
<pastedImage.png>
Am I doing it right? how can export the calculated areaSAS per atom and residue from chimera?
How the SAS values calculated in Chimera? Does t he higher value means that this residue is more exposed?
Thank you for your help, Anastasia
participants (2)
-
 anastasia@campus.technion.ac.il
 -
 Elaine Meng