Electrostatics potential of amino acid residues

Regards all, i wanted to calculate the calculate the Electrostatics potential associated with a specific part of the protein and differentiate from the other part of protein. How can it Possible . is there any method apart from MD to plot a graph of both to diffrentiate Quantitatively the The Potential Thanks in advance Ankush Sharma On Fri, Jan 13, 2012 at 5:54 PM, <chimera-users-request@cgl.ucsf.edu> wrote:
Send Chimera-users mailing list submissions to chimera-users@cgl.ucsf.edu
To subscribe or unsubscribe via the World Wide Web, visit http://plato.cgl.ucsf.edu/mailman/listinfo/chimera-users or, via email, send a message with subject or body 'help' to chimera-users-request@cgl.ucsf.edu
You can reach the person managing the list at chimera-users-owner@cgl.ucsf.edu
When replying, please edit your Subject line so it is more specific than "Re: Contents of Chimera-users digest..."
Today's Topics:
1. issue in the installation (kaushlesh mishra) 2. Fwd: Re: issue in the installation (Greg Couch) 3. going through saved scenes (Bala subramanian) 4. modeller chimera interface (Mahmoud Soliman)
----------------------------------------------------------------------
Message: 1 Date: Thu, 12 Jan 2012 19:37:50 +0530 From: kaushlesh mishra <kaushelesh.mishra@gmail.com> To: "chimera-users@cgl.ucsf.edu" <chimera-users@cgl.ucsf.edu> Subject: [Chimera-users] issue in the installation Message-ID: <CAOMCm+pMFrOJfGnk6v7-+ULpVs8XMJDC+6RW1eqZkZj_k03qGw@mail.gmail.com
Content-Type: text/plain; charset=ISO-8859-1
Hi, I?ve tried hardly to intall the last Chimera version for Windows (chimera 1.5.3), but at the phyton execution time, I have this message: "Unable to execute file: C\Archivos de programa\Chimera 1.5.3rc\phyton.exe Create process failed; code 14001" Ifound this error and it possible solution in internet, without any success. Could you help me?
-- Regards
Kaushlesh Mishra
------------------------------
Message: 2 Date: Thu, 12 Jan 2012 13:11:59 -0800 From: Greg Couch <gregc@cgl.ucsf.edu> To: Chimera-users@cgl.ucsf.edu Subject: [Chimera-users] Fwd: Re: issue in the installation Message-ID: <4F0F4C9F.8050703@cgl.ucsf.edu> Content-Type: text/plain; charset="iso-8859-1"; Format="flowed"
FYI
-------- Original Message -------- Subject: Re: [Chimera-users] issue in the installation Date: Thu, 12 Jan 2012 12:58:39 -0800 From: Greg Couch <gregc@cgl.ucsf.edu> To: kaushlesh mishra <kaushelesh.mishra@gmail.com>
On 01/12/2012 06:07 AM, kaushlesh mishra wrote:
Hi, I?ve tried hardly to intall the last Chimera version for Windows (chimera 1.5.3), but at the phyton execution time, I have this message: "Unable to execute file: C\Archivos de programa\Chimera 1.5.3rc\phyton.exe Create process failed; code 14001" Ifound this error and it possible solution in internet, without any success. Could you help me?
Hello,
The last time I saw this, it was because the computer didn't have the Microsoft Visual Studio 2008 runtime installed. Please try installing the runtime from Microsoft at
http://www.microsoft.com/downloads/en/details.aspx?FamilyID=9b2da534-3e03-43... < http://www.microsoft.com/downloads/en/details.aspx?FamilyID=9b2da534-3e03-43...
and then see if the chimera installation works.
HTH,
Greg

Hi Ankush, If you want to show the electrostatic potential by coloring the molecular surface in Chimera, please see this recent post for two possible ways: <http://plato.cgl.ucsf.edu/pipermail/chimera-users/2012-January/007058.html> See also this tutorial: <http://www.cgl.ucsf.edu/chimera/docs/UsersGuide/tutorials/surfprop.html> For plotting, you would need to use some other program. Also, it is unclear what would be on the X-axis and Y-axis of this plot, since the potential varies in 3D space. There is not a single potential value per residue or anything like that. For comparing electrostatics of proteins, you might be interested in this web server: <http://pipsa.eml.org/pipsa/> I hope this helps, Elaine ----- Elaine C. Meng, Ph.D. UCSF Computer Graphics Lab (Chimera team) and Babbitt Lab Department of Pharmaceutical Chemistry University of California, San Francisco On Jan 13, 2012, at 9:05 AM, Ankush Sharma wrote:
Regards all, i wanted to calculate the calculate the Electrostatics potential associated with a specific part of the protein and differentiate from the other part of protein. How can it Possible . is there any method apart from MD to plot a graph of both to diffrentiate Quantitatively the The Potential Thanks in advance Ankush Sharma
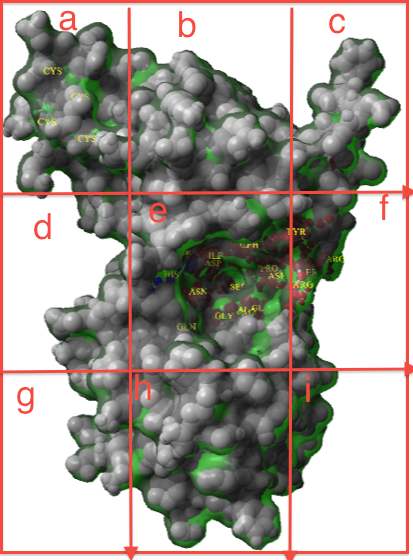
Regards Elaine , Thank s Elaine for your reply i'm aware of these facts . what I wanted to say if we considered the protein divided into grid boxes , i need to calculate electrostatic potential of one particular area( in attached fig box e) . Plot can be plotted on X axis as the distance acquired by electrostatic potential surface from the centre of the protein (for whole protein). For One grid or one box, distance acquired by the electrostatic potential surface from the centre of that part of protein to the distance of the one grid( off course protein will be divided into many grids while performing these kinds of analysis.) and Y axis Will the electrostatic potential. Thanks Ankush Sharma Hi Ankush,
If you want to show the electrostatic potential by coloring the molecular surface in Chimera, please see this recent post for two possible ways: < http://plato.cgl.ucsf.edu/pipermail/chimera-users/2012-January/007058.html
See also this tutorial: <http://www.cgl.ucsf.edu/chimera/docs/UsersGuide/tutorials/surfprop.html>
For plotting, you would need to use some other program. Also, it is unclear what would be on the X-axis and Y-axis of this plot, since the potential varies in 3D space. There is not a single potential value per residue or anything like that.
For comparing electrostatics of proteins, you might be interested in this web server: <http://pipsa.eml.org/pipsa/>
I hope this helps, Elaine ----- Elaine C. Meng, Ph.D. UCSF Computer Graphics Lab (Chimera team) and Babbitt Lab Department of Pharmaceutical Chemistry University of California, San Francisco
On Jan 13, 2012, at 9:05 AM, Ankush Sharma wrote:
Regards all, i wanted to calculate the calculate the Electrostatics potential associated with a specific part of the protein and differentiate from the other part of protein. How can it Possible . is there any method apart from MD to plot a graph of both to diffrentiate Quantitatively the The Potential Thanks in advance Ankush Sharma
-- Regards Ankush Sharma Doctoral student in Computational Biology Second University of Naples & Centro Ricerche Oncologiche di Mercogliano Email ID : ankush.sharma@unina2.it Phone: +39 331 831 6370 *P** Please do not print this email unless it is absolutely necessary. Spread environmental awareness.*
file attached for better understanding. On Fri, Jan 13, 2012 at 6:48 PM, Ankush Sharma <ankush.sak@gmail.com> wrote:
Regards Elaine ,
Thank s Elaine for your reply i'm aware of these facts . what I wanted to say if we considered the protein divided into grid boxes , i need to calculate electrostatic potential of one particular area( in attached fig box e) . Plot can be plotted on X axis as the distance acquired by electrostatic potential surface from the centre of the protein (for whole protein). For One grid or one box, distance acquired by the electrostatic potential surface from the centre of that part of protein to the distance of the one grid( off course protein will be divided into many grids while performing these kinds of analysis.) and Y axis Will the electrostatic potential.
Thanks Ankush Sharma
Hi Ankush,
If you want to show the electrostatic potential by coloring the molecular surface in Chimera, please see this recent post for two possible ways: < http://plato.cgl.ucsf.edu/pipermail/chimera-users/2012-January/007058.html
See also this tutorial: <http://www.cgl.ucsf.edu/chimera/docs/UsersGuide/tutorials/surfprop.html>
For plotting, you would need to use some other program. Also, it is unclear what would be on the X-axis and Y-axis of this plot, since the potential varies in 3D space. There is not a single potential value per residue or anything like that.
For comparing electrostatics of proteins, you might be interested in this web server: <http://pipsa.eml.org/pipsa/>
I hope this helps, Elaine ----- Elaine C. Meng, Ph.D. UCSF Computer Graphics Lab (Chimera team) and Babbitt Lab Department of Pharmaceutical Chemistry University of California, San Francisco
On Jan 13, 2012, at 9:05 AM, Ankush Sharma wrote:
Regards all, i wanted to calculate the calculate the Electrostatics potential associated with a specific part of the protein and differentiate from the other part of protein. How can it Possible . is there any method apart from MD to plot a graph of both to diffrentiate Quantitatively the The Potential Thanks in advance Ankush Sharma
-- Regards Ankush Sharma Doctoral student in Computational Biology Second University of Naples & Centro Ricerche Oncologiche di Mercogliano Email ID : ankush.sharma@unina2.it Phone: +39 331 831 6370
*P** Please do not print this email unless it is absolutely necessary. Spread environmental awareness.*
-- Regards Ankush Sharma Doctoral student in Computational Biology Second University of Naples & Centro Ricerche Oncologiche di Mercogliano Email ID : ankush.sharma@unina2.it Phone: +39 331 831 6370 *P** Please do not print this email unless it is absolutely necessary. Spread environmental awareness.*
Hi Ankush, For calculating ESP of only certain atoms, you would delete the other atoms first... however, it may not be meaningful. The simpler, more approximate Coulombic ESP is additive, but Poisson-Boltzmann ESP depends on the shape of the whole protein and locations of all of the charges (it is not simply adding contributions of each atom). Regardless of how you calculate the values, to do the 2D plotting you would need to use another program. Best, Elaine ----- Elaine C. Meng, Ph.D. UCSF Computer Graphics Lab (Chimera team) and Babbitt Lab Department of Pharmaceutical Chemistry University of California, San Francisco On Jan 13, 2012, at 9:50 AM, Ankush Sharma wrote:
file attached for better understanding.
On Fri, Jan 13, 2012 at 6:48 PM, Ankush Sharma <ankush.sak@gmail.com> wrote: Regards Elaine ,
Thank s Elaine for your reply i'm aware of these facts . what I wanted to say if we considered the protein divided into grid boxes , i need to calculate electrostatic potential of one particular area( in attached fig box e) . Plot can be plotted on X axis as the distance acquired by electrostatic potential surface from the centre of the protein (for whole protein). For One grid or one box, distance acquired by the electrostatic potential surface from the centre of that part of protein to the distance of the one grid( off course protein will be divided into many grids while performing these kinds of analysis.) and Y axis Will the electrostatic potential.
Thanks Ankush Sharma
Hi Ankush, If you want to show the electrostatic potential by coloring the molecular surface in Chimera, please see this recent post for two possible ways: <http://plato.cgl.ucsf.edu/pipermail/chimera-users/2012-January/007058.html>
See also this tutorial: <http://www.cgl.ucsf.edu/chimera/docs/UsersGuide/tutorials/surfprop.html>
For plotting, you would need to use some other program. Also, it is unclear what would be on the X-axis and Y-axis of this plot, since the potential varies in 3D space. There is not a single potential value per residue or anything like that.
For comparing electrostatics of proteins, you might be interested in this web server: <http://pipsa.eml.org/pipsa/>
I hope this helps, Elaine ----- Elaine C. Meng, Ph.D. UCSF Computer Graphics Lab (Chimera team) and Babbitt Lab Department of Pharmaceutical Chemistry University of California, San Francisco
On Jan 13, 2012, at 9:05 AM, Ankush Sharma wrote:
Regards all, i wanted to calculate the calculate the Electrostatics potential associated with a specific part of the protein and differentiate from the other part of protein. How can it Possible . is there any method apart from MD to plot a graph of both to diffrentiate Quantitatively the The Potential Thanks in advance Ankush Sharma
-- Regards Ankush Sharma Doctoral student in Computational Biology Second University of Naples & Centro Ricerche Oncologiche di Mercogliano Email ID : ankush.sharma@unina2.it Phone: +39 331 831 6370
P Please do not print this email unless it is absolutely necessary. Spread environmental awareness.
-- Regards Ankush Sharma Doctoral student in Computational Biology Second University of Naples & Centro Ricerche Oncologiche di Mercogliano Email ID : ankush.sharma@unina2.it Phone: +39 331 831 6370
P Please do not print this email unless it is absolutely necessary. Spread environmental awareness.
<Untitled.png>_______________________________________________ Chimera-users mailing list Chimera-users@cgl.ucsf.edu http://plato.cgl.ucsf.edu/mailman/listinfo/chimera-users

Hi, Following this thread prompts me to ask the following question. Assume that one is dealing with highly homologous proteins, is there a way of telling the "fine" differences in the electrostatic potential of the residues encompassing the binding cavity (buried residues). Thanks in advance for any suggestions. George On Jan 13, 2012, at 7:14 PM, Elaine Meng wrote:
Hi Ankush, For calculating ESP of only certain atoms, you would delete the other atoms first... however, it may not be meaningful. The simpler, more approximate Coulombic ESP is additive, but Poisson-Boltzmann ESP depends on the shape of the whole protein and locations of all of the charges (it is not simply adding contributions of each atom).
Regardless of how you calculate the values, to do the 2D plotting you would need to use another program. Best, Elaine ----- Elaine C. Meng, Ph.D. UCSF Computer Graphics Lab (Chimera team) and Babbitt Lab Department of Pharmaceutical Chemistry University of California, San Francisco
On Jan 13, 2012, at 9:50 AM, Ankush Sharma wrote:
file attached for better understanding.
On Fri, Jan 13, 2012 at 6:48 PM, Ankush Sharma <ankush.sak@gmail.com> wrote: Regards Elaine ,
Thank s Elaine for your reply i'm aware of these facts . what I wanted to say if we considered the protein divided into grid boxes , i need to calculate electrostatic potential of one particular area( in attached fig box e) . Plot can be plotted on X axis as the distance acquired by electrostatic potential surface from the centre of the protein (for whole protein). For One grid or one box, distance acquired by the electrostatic potential surface from the centre of that part of protein to the distance of the one grid( off course protein will be divided into many grids while performing these kinds of analysis.) and Y axis Will the electrostatic potential.
Thanks Ankush Sharma
Hi Ankush, If you want to show the electrostatic potential by coloring the molecular surface in Chimera, please see this recent post for two possible ways: <http://plato.cgl.ucsf.edu/pipermail/chimera-users/2012-January/007058.html>
See also this tutorial: <http://www.cgl.ucsf.edu/chimera/docs/UsersGuide/tutorials/surfprop.html>
For plotting, you would need to use some other program. Also, it is unclear what would be on the X-axis and Y-axis of this plot, since the potential varies in 3D space. There is not a single potential value per residue or anything like that.
For comparing electrostatics of proteins, you might be interested in this web server: <http://pipsa.eml.org/pipsa/>
I hope this helps, Elaine ----- Elaine C. Meng, Ph.D. UCSF Computer Graphics Lab (Chimera team) and Babbitt Lab Department of Pharmaceutical Chemistry University of California, San Francisco
On Jan 13, 2012, at 9:05 AM, Ankush Sharma wrote:
Regards all, i wanted to calculate the calculate the Electrostatics potential associated with a specific part of the protein and differentiate from the other part of protein. How can it Possible . is there any method apart from MD to plot a graph of both to diffrentiate Quantitatively the The Potential Thanks in advance Ankush Sharma
-- Regards Ankush Sharma Doctoral student in Computational Biology Second University of Naples & Centro Ricerche Oncologiche di Mercogliano Email ID : ankush.sharma@unina2.it Phone: +39 331 831 6370
P Please do not print this email unless it is absolutely necessary. Spread environmental awareness.
-- Regards Ankush Sharma Doctoral student in Computational Biology Second University of Naples & Centro Ricerche Oncologiche di Mercogliano Email ID : ankush.sharma@unina2.it Phone: +39 331 831 6370
P Please do not print this email unless it is absolutely necessary. Spread environmental awareness.
<Untitled.png>_______________________________________________ Chimera-users mailing list Chimera-users@cgl.ucsf.edu http://plato.cgl.ucsf.edu/mailman/listinfo/chimera-users
_______________________________________________ Chimera-users mailing list Chimera-users@cgl.ucsf.edu http://plato.cgl.ucsf.edu/mailman/listinfo/chimera-users
Hi George, In Chimera, the main possibilities are: (A) side-by-side visualization by coloring molecular surfaces or showing isopotential contours (see Surface Color and Volume Viewer tools) <http://www.cgl.ucsf.edu/chimera/docs/ContributedSoftware/surfcolor/surfcolor...> <http://www.cgl.ucsf.edu/chimera/docs/ContributedSoftware/volumeviewer/framev...> (B) reporting values of superimposed ESP maps at some probe atom position(s) (see Values at Atom Positions) <http://www.cgl.ucsf.edu/chimera/docs/ContributedSoftware/density/density.htm...> (C) calculating difference map of superimposed ESP maps (see command "vop subtract") <http://www.cgl.ucsf.edu/chimera/docs/UsersGuide/midas/vop.html> All of these require carefully superimposing the structures/maps (and for A, subsequently translating them apart without disrupting orientation). I suspect C might be swamped out by noise and not give a useful result, but I haven't tried it. You might take a look at the PIPSA server mentioned earlier... I don't recall all of its capabilities. <http://pipsa.eml.org/pipsa/> Elaine ----- Elaine C. Meng, Ph.D. UCSF Computer Graphics Lab (Chimera team) and Babbitt Lab Department of Pharmaceutical Chemistry University of California, San Francisco P.S. your return address is not the same as the email you suggested I use, so I used both... however, please update your return address if that's what you want used On Jan 13, 2012, at 10:20 AM, George Tzotzos wrote:
Hi, Following this thread prompts me to ask the following question. Assume that one is dealing with highly homologous proteins, is there a way of telling the "fine" differences in the electrostatic potential of the residues encompassing the binding cavity (buried residues). Thanks in advance for any suggestions. George
Many thanks Elaine, much appreciated Regars George On Jan 13, 2012, at 7:43 PM, Elaine Meng wrote:
Hi George, In Chimera, the main possibilities are:
(A) side-by-side visualization by coloring molecular surfaces or showing isopotential contours (see Surface Color and Volume Viewer tools) <http://www.cgl.ucsf.edu/chimera/docs/ContributedSoftware/surfcolor/surfcolor...> <http://www.cgl.ucsf.edu/chimera/docs/ContributedSoftware/volumeviewer/framev...>
(B) reporting values of superimposed ESP maps at some probe atom position(s) (see Values at Atom Positions) <http://www.cgl.ucsf.edu/chimera/docs/ContributedSoftware/density/density.htm...>
(C) calculating difference map of superimposed ESP maps (see command "vop subtract") <http://www.cgl.ucsf.edu/chimera/docs/UsersGuide/midas/vop.html>
All of these require carefully superimposing the structures/maps (and for A, subsequently translating them apart without disrupting orientation). I suspect C might be swamped out by noise and not give a useful result, but I haven't tried it.
You might take a look at the PIPSA server mentioned earlier... I don't recall all of its capabilities. <http://pipsa.eml.org/pipsa/>
Elaine ----- Elaine C. Meng, Ph.D. UCSF Computer Graphics Lab (Chimera team) and Babbitt Lab Department of Pharmaceutical Chemistry University of California, San Francisco
P.S. your return address is not the same as the email you suggested I use, so I used both... however, please update your return address if that's what you want used
On Jan 13, 2012, at 10:20 AM, George Tzotzos wrote:
Hi, Following this thread prompts me to ask the following question. Assume that one is dealing with highly homologous proteins, is there a way of telling the "fine" differences in the electrostatic potential of the residues encompassing the binding cavity (buried residues). Thanks in advance for any suggestions. George
participants (3)
-
 Ankush Sharma
 -
 Elaine Meng
 -
 George Tzotzos