Help in executing python script in per-frame analysis

Hi I am analysing a protein molecule (MD simulations). I wrote a python script to calculate inertia for the protein and ran it over 40000 frames. I got a data in log file but it is creating a ellipsoid around the molecule. I want 3 axes of the ellipsoid to be shown in that protein molecule not the ellipsoid as it covers the whole protein molecule. So that I can easily visualize the movement of all 3 axes of ellipsoid over the 40000 frames (means how the axes are changing during trajectory run). Thanks Ankit Department of Chemical Science IISER-Mohali, India

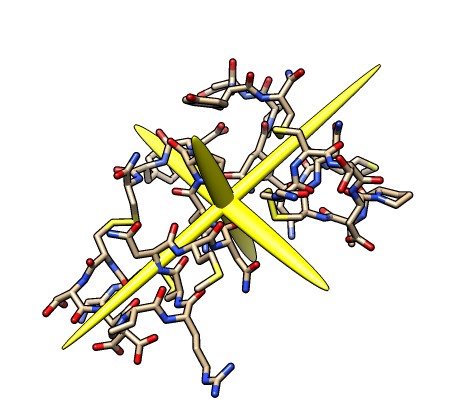
Hi Ankit, Chimera does not have a display style to show the inertia of a molecule as 3 axes. But here is a quick way to hack that in. You can change a little bit of Python code in your Chimera 1.10 distribution so that it shows three narrow ellipsoids that represent the axes. Use a text editor to edit chimera/share/measure/inertia.py or on Mac Chimera.app/Contents/Resources/share/measure/inertia.py and replace the ellipsoid surface function def ellipsoid_surface(axes, lengths, center, color, surface): xf = surface.openState.xform.inverse() sa, sc = transform_ellipsoid(axes, center, xf) varray, tarray = ellipsoid_geometry(sc, sa, lengths) p = surface.addPiece(varray, tarray, color) p.save_in_session = True return p with def ellipsoid_surface(axes, lengths, center, color, surface): xf = surface.openState.xform.inverse() sa, sc = transform_ellipsoid(axes, center, xf) for sx,sy,sz in [(1,.05,.05), (.05,1,.05), (.05,.05,1)]: lx,ly,lz = lengths varray, tarray = ellipsoid_geometry(sc, sa, (lx*sx,ly*sy,lz*sz)) p = surface.addPiece(varray, tarray, color) p.save_in_session = True return p then save the file, restart Chimera and now “measure inertia #0 color yellow” will show the 3 axes. Make sure to keep the indentation of the code since that is important in the Python computer language. This change is scaling down 2 of the 3 ellipsoid axes by a factor of 0.05. You can change the 0.05 value to say 0.01 if you want thinner axis ellipsoids. Tom
On Feb 5, 2015, at 3:41 AM, Ankit Agrawal wrote:
Hi I am analysing a protein molecule (MD simulations). I wrote a python script to calculate inertia for the protein and ran it over 40000 frames. I got a data in log file but it is creating a ellipsoid around the molecule.
I want 3 axes of the ellipsoid to be shown in that protein molecule not the ellipsoid as it covers the whole protein molecule. So that I can easily visualize the movement of all 3 axes of ellipsoid over the 40000 frames (means how the axes are changing during trajectory run).
Thanks Ankit Department of Chemical Science IISER-Mohali, India _______________________________________________ Chimera-users mailing list Chimera-users@cgl.ucsf.edu http://plato.cgl.ucsf.edu/mailman/listinfo/chimera-users
participants (2)
-
 Ankit Agrawal
 -
 Tom Goddard