
Yes, the two behave differently, and not only as to importing pdb. I had opened my combined trajectories (protein+ligand in a lipid membrane) in VMD while looking at either the ligand or the protein: both highly distorted at each one of the 550 frames. I only got nearly reasonable structure for the ligand by averaging the frames. That was most discouraging in the last few days. Did the same for the equilibration and got the same discouraging results. This last analysis was not fitting the analysis with ptraj, Therefore I have now done the same for the MD trajectories with Chimera, which runs more slowly along the frames, and surprisingly, "at the naked eye" both the ligand and the protein save their correct structure along the 550 frames, with only the internal displacement on/back that one expects from MD. I repeated without hiding the membrane and water, and "at the naked" the ligand was not wandering around. I looked at RMDS Maps(Start frame 1; End 550; Step size 2; RMSD map of trajectory against itself; Lower rmsd threshold 2.9, higher 3.9: RMSD varied from 0.194 to 1.810 for the ligand and from 0.612 to 2.420 for the protein. Is that variation too much for accepting this MD for good (or fair) and continuing it with same settings? If it is a too large a range, that explains why the ligand encountered so many protein residues when the mask was used. I was unable to find how to get a plot of RMSD against time. I would like to do that for the ligand (which is a single big residue) and selected residues of the protein. Thanks francesco --- Francesco Pietra <chiendarret@yahoo.com> wrote:
Date: Tue, 15 Jan 2008 06:44:21 -0800 (PST) From: Francesco Pietra <chiendarret@yahoo.com> Subject: Re: [Chimera-users] Bug (?) with EnsembleCluster To: Eric Pettersen <pett@cgl.ucsf.edu> CC: chimera BB <chimera-users@cgl.ucsf.edu>
Got FMI, thanks. That seems a reasonable rationalization. Though, if I understand, importing pdb files without saturating memory (may be importing one "model", analyzing it, and then removing it from memory before importing next "model", or any other better idea) is something to overcome in order to have Chimera carrying out cluster analysis. Or I do not understand or cluster analysis is of minor interest, both equally possible.
francesco
--- Eric Pettersen <pett@cgl.ucsf.edu> wrote:
Just FYI, when you open a 5000 MODEL structure with Chimera's normal File...Open, you get 5000 completely separate models (and will likely exhaust memory unless its a small molecule). Each model can be colored individually, moved, mutated, closed, etc. individually. When you open the same 5000 MODEL file with the MD Movie extension you get _one_ model with 5000 sets of coordinates, which takes much less memory. On the other hand, each frame shares colors and so forth with all the other frames, cannot be moved with respect to the other frames, etc. VMD undoubtedly uses the latter approach.
--Eric
Eric Pettersen UCSF Computer Graphics Lab http://www.cgl.ucsf.edu
On Jan 11, 2008, at 3:04 PM, Francesco Pietra wrote:
Yes, 5365. What happened will be discovered. Up to the stage on amber_score_everything, all was perfectly OK. Minimization and heating was also OK. As to MD, the situation could not be clarified so far.
In view of your comments below, I carried out a check with proven MD. I went to Amber tutorial B3, took equil1.mdcrd.gz, decompressed, took the related prmtop, and fed the two files to Chimera, last Daily Building. After all 5000 steps had been acquired, saved pdb, all frames. Quit MD Movie. Try to open this pdb. Well, with my modest desktop, Debian Linux i386, 1GB ram, this pdb could not be opened: rapidly the memory was exhausted and to get control of the computer I had to kill gnome. With vmd, this pdb developed rapidly with all 5000 frames. Exactly as with the pdb from MD with my protein. This does not mean that my MDs are OK. I'll look for what may be wrong there.
Thanks francesco
--- Eric Pettersen <pett@cgl.ucsf.edu> wrote:
5365 atoms? Given average atom counts in protonated protein residues that means your ligand came in close contact with ~340 residues over the course of the trajectory -- so it's wandering all over the place. I can see why you want to use cluster analysis. Oh well, I guess we're stuck until I have time to coordinate with Conrad and integrate his clustering code with MD Movie.
--Eric
On Jan 10, 2008, at 6:38 AM, Francesco Pietra wrote:
Eric: I followed previous route from combined mdcrd from ptraj.
Removed remaining water.
select ligand z<2.5
as Chimera command; (this was the minimum, selecting 244 atoms, 118 of which for the ligand; with z<2.0 the ligand only is selected)
On playing the pdb (saved for selected atoms only) (with LOOP deselected) the atom selection increased, reaching 5365 atoms at the last (549) frame. In another run, with z<4.0 the course of atom selection was similar, reaching 5993 atoms at frame 549.
This huge number of atoms proved problematic for opening pdb. For the z<2.5 case I left the computer on for 4h and half, with python occupying 98% of the available MEM (nearly 1GB). I had to kill gnome to recover command.
May be with much more MEM it will work, though I can't check that now.
I did not try to combine the trajectories with Chimera as I have no indication that those from ptraj are faulty. The pdb files for both z<2.5 and z<4.0 open in vmd.
francesco
--- Eric Pettersen <pett@cgl.ucsf.edu> wrote:
On Jan 9, 2008, at 3:32 PM, Francesco Pietra wrote:
> In the "Define script.." I defined "select ligand z<10", then OK > and a BUG > window was presented. Attached is the reply log (bug). I tried > with > z<4 with > the same result (actually, I don't remember if attached bug file > refers to z<10 > or z<4).
In the script-definition dialog you need to have "Interpret script as" set to "Chimera commands". You had it set to "Python".
> Still found difficulties in loading more than one mdcrd, though > this should be > my fault. I was not sure if the list of mdcrd is to be given at > beginning or if > the other mdcrd files after the first one are to be given > subsequently from the > menu. I tried with the "list" option but only the first mdcrd was > opened.
When you run MD Movie and the dialog comes up where you specify the prmtop/trajectory files, you can use the "Add..." button to add as many trajectory files as needed. I think this means you "give it at the beginning" rather than "subsequently from the menu" in your terminology.
You can also just list the files in a "metafile" for the command line. For instance, this file works for me:
amber leap.top md01.crd md02.crd md03.crd md04.crd md05.crd md06.crd
Note that there _still_ seems to be something funky with Amber compressed trajectories, so don't use them for now but I should have things fixed in a day or so with that.
--Eric
____________________________________________________________________ __ ______________ Be a better friend, newshound, and know-it-all with Yahoo! Mobile. Try it now. http:// mobile.yahoo.com/;_ylt=Ahu06i62sR8HDtDypao8Wcj9tAcJ
______________________________________________________________________ ______________ Looking for last minute shopping deals? Find them fast with Yahoo! Search. http://tools.search.yahoo.com/ newsearch/category.php?category=shopping
____________________________________________________________________________________
Be a better friend, newshound, and know-it-all with Yahoo! Mobile. Try it now. http://mobile.yahoo.com/;_ylt=Ahu06i62sR8HDtDypao8Wcj9tAcJ
____________________________________________________________________________________ Looking for last minute shopping deals? Find them fast with Yahoo! Search. http://tools.search.yahoo.com/newsearch/category.php?category=shopping

Hi Francesco, There is no feature yet in Chimera to plot values (such as RMSD) vs. time for a trajectory, sorry. If you look at just the top tiny line in the RMSD map (frame 1 vs. all the others) it contains that information in terms of color, but I agree that is not as easy to look at as a plot. I don't know what happened in VMD; maybe there was some error. It is difficult to say what value of RMSD would correspond to too much variation. The values you gave don't sound that high to me, but probably your judgement when viewing the trajectory is a better tool than some numerical cutoff for deciding if it is reasonable or not. Does the interaction observed in your trajectory agree with any experimental data on what residues contact the ligand? Or if you started with an experimentally determined structure of the complex, does it stay in approximately the same binding site? (sounds like it does) Another thing to consider is that often people start with a minimization to remove any severe strains or clashes, then some equilibration MD before the production MD. It depends on whether your system is already equilibrated, or perhaps if the RMSD just keeps increasing throughout the trajectory, the system is unstable and will not equilibrate. The following I mainly mention for completeness... it may not be helpful in your case: There is another tool, EnsembleMatch, that shows the RMSD values as numbers (instead of a color map) for an all-by-all comparison of two ensembles, but it is only good for much smaller sets of structures. For example, you could compare one structure (frame 1, or crystal structure if you have it) to a sample of maybe 10 structures from the trajectory. http://www.cgl.ucsf.edu/chimera/docs/ContributedSoftware/ ensemblematch/ensemblematch.html Best, Elaine ----- Elaine C. Meng, Ph.D. meng@cgl.ucsf.edu UCSF Computer Graphics Lab and Babbitt Lab Department of Pharmaceutical Chemistry University of California, San Francisco http://www.cgl.ucsf.edu/home/meng/index.html On Jan 16, 2008, at 8:19 AM, Francesco Pietra wrote:
Yes, the two behave differently, and not only as to importing pdb.
I had opened my combined trajectories (protein+ligand in a lipid membrane) in VMD while looking at either the ligand or the protein: both highly distorted at each one of the 550 frames. I only got nearly reasonable structure for the ligand by averaging the frames. That was most discouraging in the last few days. Did the same for the equilibration and got the same discouraging results. This last analysis was not fitting the analysis with ptraj,
Therefore I have now done the same for the MD trajectories with Chimera, which runs more slowly along the frames, and surprisingly, "at the naked eye" both the ligand and the protein save their correct structure along the 550 frames, with only the internal displacement on/back that one expects from MD. I repeated without hiding the membrane and water, and "at the naked" the ligand was not wandering around.
I looked at RMDS Maps(Start frame 1; End 550; Step size 2; RMSD map of trajectory against itself; Lower rmsd threshold 2.9, higher 3.9: RMSD varied from 0.194 to 1.810 for the ligand and from 0.612 to 2.420 for the protein. Is that variation too much for accepting this MD for good (or fair) and continuing it with same settings? If it is a too large a range, that explains why the ligand encountered so many protein residues when the mask was used.
I was unable to find how to get a plot of RMSD against time. I would like to do that for the ligand (which is a single big residue) and selected residues of the protein.
Thanks francesco
--- Elaine Meng <meng@cgl.ucsf.edu> wrote:
Hi Francesco, There is no feature yet in Chimera to plot values (such as RMSD) vs. time for a trajectory, sorry.
I hope you may plan to offer such useful tool.
If you look at just the top tiny line in the RMSD map (frame 1 vs. all the others) it contains that information in terms of color,
I may have better waited until I understand what you suggest. It is the hope to further clarify my things that urges me to ask for that explained with other words. I don't understand where to look at.
but I agree that is not as easy to look at as a plot.
I don't know what happened in VMD; maybe there was some error.
It is difficult to say what value of RMSD would correspond to too much variation. The values you gave don't sound that high to me, but probably your judgment when viewing the trajectory is a better tool than some numerical cutoff for deciding if it is reasonable or not.
That is reassuring. As I said, things "at the naked eye" look like OK. And the judgment is competent because the ligand is an organic structure I am familiar with. No repeating unit, special bond lengths and orientations, no common stuff.
Does the interaction observed in your trajectory agree with any experimental data on what residues contact the ligand? Or if you started with an experimentally determined structure of the complex, does it stay in approximately the same binding site? (sounds like it does) Another thing to consider is that often people start with a minimization to remove any severe strains or clashes, then some equilibration MD before the production MD. It depends on whether your system is already equilibrated,
It was carefully heated to 300K and equilibrated removing restraints step by step, i.e., first by the lipid, then by the protein-complex. If anything, I am not sure if my procedure of removing the strong restraint on the protein and ligand abruptly is correct, or if a smaller force should have been applied first. It is not easy to grasp such information from the literature.
or perhaps if the RMSD just keeps increasing throughout the trajectory,
I am acquiring experience on these affairs. As far as I presently understand, RMSD is not increasing along the trajectory. Well, a plot of RMSD vs time would be the best answer. Thanks francesco
the system is unstable and will not equilibrate.
The following I mainly mention for completeness... it may not be helpful in your case: There is another tool, EnsembleMatch, that shows the RMSD values as numbers (instead of a color map) for an all-by-all comparison of two ensembles, but it is only good for much smaller sets of structures. For example, you could compare one structure (frame 1, or crystal structure if you have it) to a sample of maybe 10 structures from the trajectory. http://www.cgl.ucsf.edu/chimera/docs/ContributedSoftware/ ensemblematch/ensemblematch.html
Best, Elaine ----- Elaine C. Meng, Ph.D. meng@cgl.ucsf.edu UCSF Computer Graphics Lab and Babbitt Lab Department of Pharmaceutical Chemistry University of California, San Francisco http://www.cgl.ucsf.edu/home/meng/index.html
On Jan 16, 2008, at 8:19 AM, Francesco Pietra wrote:
Yes, the two behave differently, and not only as to importing pdb.
I had opened my combined trajectories (protein+ligand in a lipid membrane) in VMD while looking at either the ligand or the protein: both highly distorted at each one of the 550 frames. I only got nearly reasonable structure for the ligand by averaging the frames. That was most discouraging in the last few days. Did the same for the equilibration and got the same discouraging results. This last analysis was not fitting the analysis with ptraj,
Therefore I have now done the same for the MD trajectories with Chimera, which runs more slowly along the frames, and surprisingly, "at the naked eye" both the ligand and the protein save their correct structure along the 550 frames, with only the internal displacement on/back that one expects from MD. I repeated without hiding the membrane and water, and "at the naked" the ligand was not wandering around.
I looked at RMDS Maps(Start frame 1; End 550; Step size 2; RMSD map of trajectory against itself; Lower rmsd threshold 2.9, higher 3.9: RMSD varied from 0.194 to 1.810 for the ligand and from 0.612 to 2.420 for the protein. Is that variation too much for accepting this MD for good (or fair) and continuing it with same settings? If it is a too large a range, that explains why the ligand encountered so many protein residues when the mask was used.
I was unable to find how to get a plot of RMSD against time. I would like to do that for the ligand (which is a single big residue) and selected residues of the protein.
Thanks francesco
____________________________________________________________________________________ Never miss a thing. Make Yahoo your home page. http://www.yahoo.com/r/hs
On Jan 16, 2008, at 10:35 AM, Francesco Pietra wrote:
If you look at just the top tiny line in the RMSD map (frame 1 vs. all the others) it contains that information in terms of color,
I may have better waited until I understand what you suggest. It is the hope to further clarify my things that urges me to ask for that explained with other words. I don't understand where to look at.
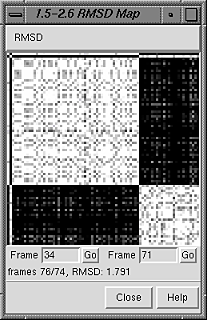
Here is the RMSD map, which is a 80 x 80 grid comparing the 80 frames in 1plx.pdb: RMSD vs. time using frame 1 as the reference is the top 1 x 80 of the grid: you see that comparison to self (grid position 1,1) is white (0 RMSD), comparison to frame 2 (grid position 1,2) is black (higher RMSD), then there are several frames with low RMSD compared to frame 1, then ending with several frames with high RMSD compared to frame 1. To use frame 2 as the reference instead of frame 1, you would use next-to-top 1 x 80 of the grid (positions 2,N), etc. Elaine

On Jan 16, 2008, at 8:19 AM, Francesco Pietra wrote:
I was unable to find how to get a plot of RMSD against time. I would like to do that for the ligand (which is a single big residue) and selected residues of the protein.
Mmmm, RSMD compared to what? Frame 1? You can't get such a plot right now, but what you can do is open your trajectory and also open a PDB file with whatever structure you want to measure RMSD with, and in the "Define script..." dialog put: echo <FRAME> match #0<+atom spec you wanted compared> #1<+atom spec you want compared> Then if you play through the trajectory, in the reply log will be pairs of lines like this: 23 1.264 which is the frame number and the RMSD. --Eric
participants (3)
-
 Elaine Meng
 -
 Eric Pettersen
 -
 Francesco Pietra