
9 Jan
2024
9 Jan
'24
8:21 p.m.
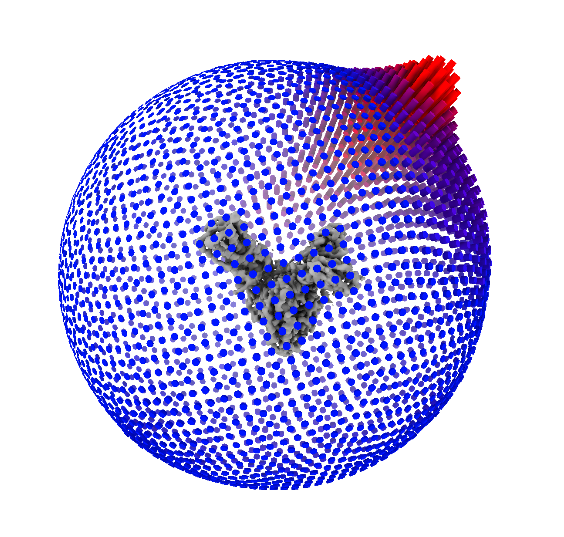
Hi, I was trying to make an angular distribution plot using .bild file. I want to show the map inside the plot as in the attachment. Few questions: -My map needs to be flipped to get the correct handedness, I think I need to flip the angular distribution plot as well, how to do that? or do I have to go back and get the .bild file for the flipped map? -How can I change the colors and transparency of the angular distribution plot? -Can I get the particle count for each cylinder in the plot? Wanted to show a scale bar for particle distribution around the sphere of the plot. Best Rayees