
3 Jul
2024
3 Jul
'24
4:24 p.m.
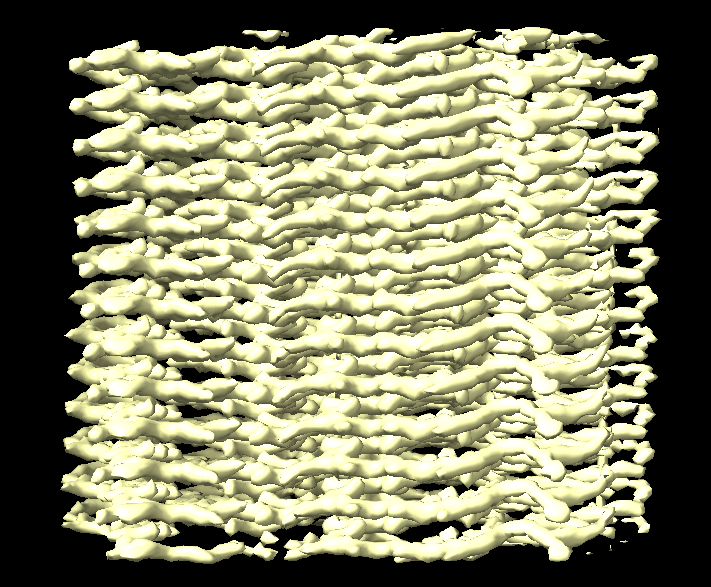
Dear all, Is there a way to display say 10% on the Z-axis of a fibril density map? Or maybe save 1 or 2 layers of the map? [cid:11c579f0-867a-4136-b817-27e4c071e57e] I know 2 ways to do it but they both take a long time, and I wonder if we have an easier way to do it. 1. Use volume eraser with a big diameter sphere 2. Build a rough backbone carbon model in 1 layer, and do zone selection. Thanks, B ________________________________ UT Southwestern Medical Center The future of medicine, today.