
29 Jan
2025
29 Jan
'25
2:44 a.m.
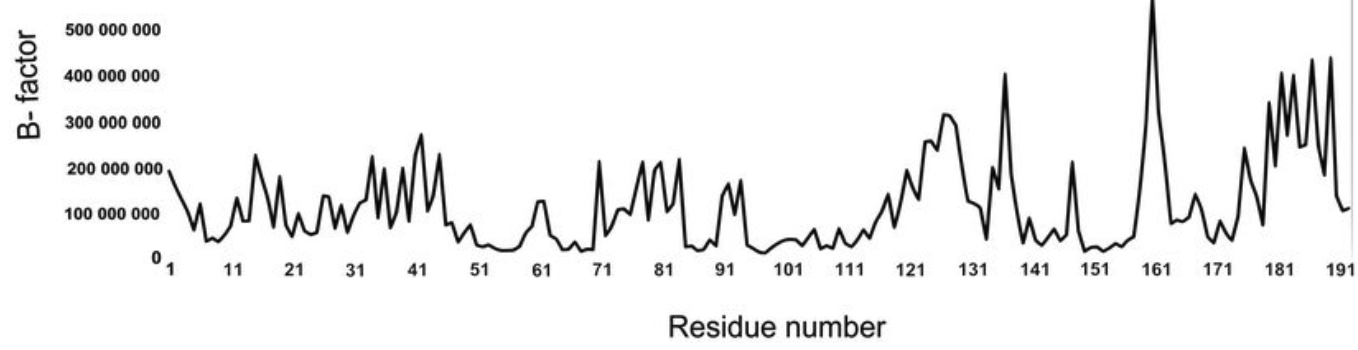
Dear ChimeraX team, I wondered if it is possible to generate a line or scatter plot of an attribute value (B factor, Alphafold pLDDT scores, or AlphafoldMissense score…) over the residue number? For example something like this (taken from https://journals.plos.org/plosone/article?id=10.1371/journal.pone.0089116) : [cid:image001.png@01DB7242.B1C3F8A0] Specifically, for the AlphafoldMissense data, such a plot would be more informative then the default histogram that is displayed when fetching the scores when looking for functional hotspots in your POI. Many thanks, MAtthias