
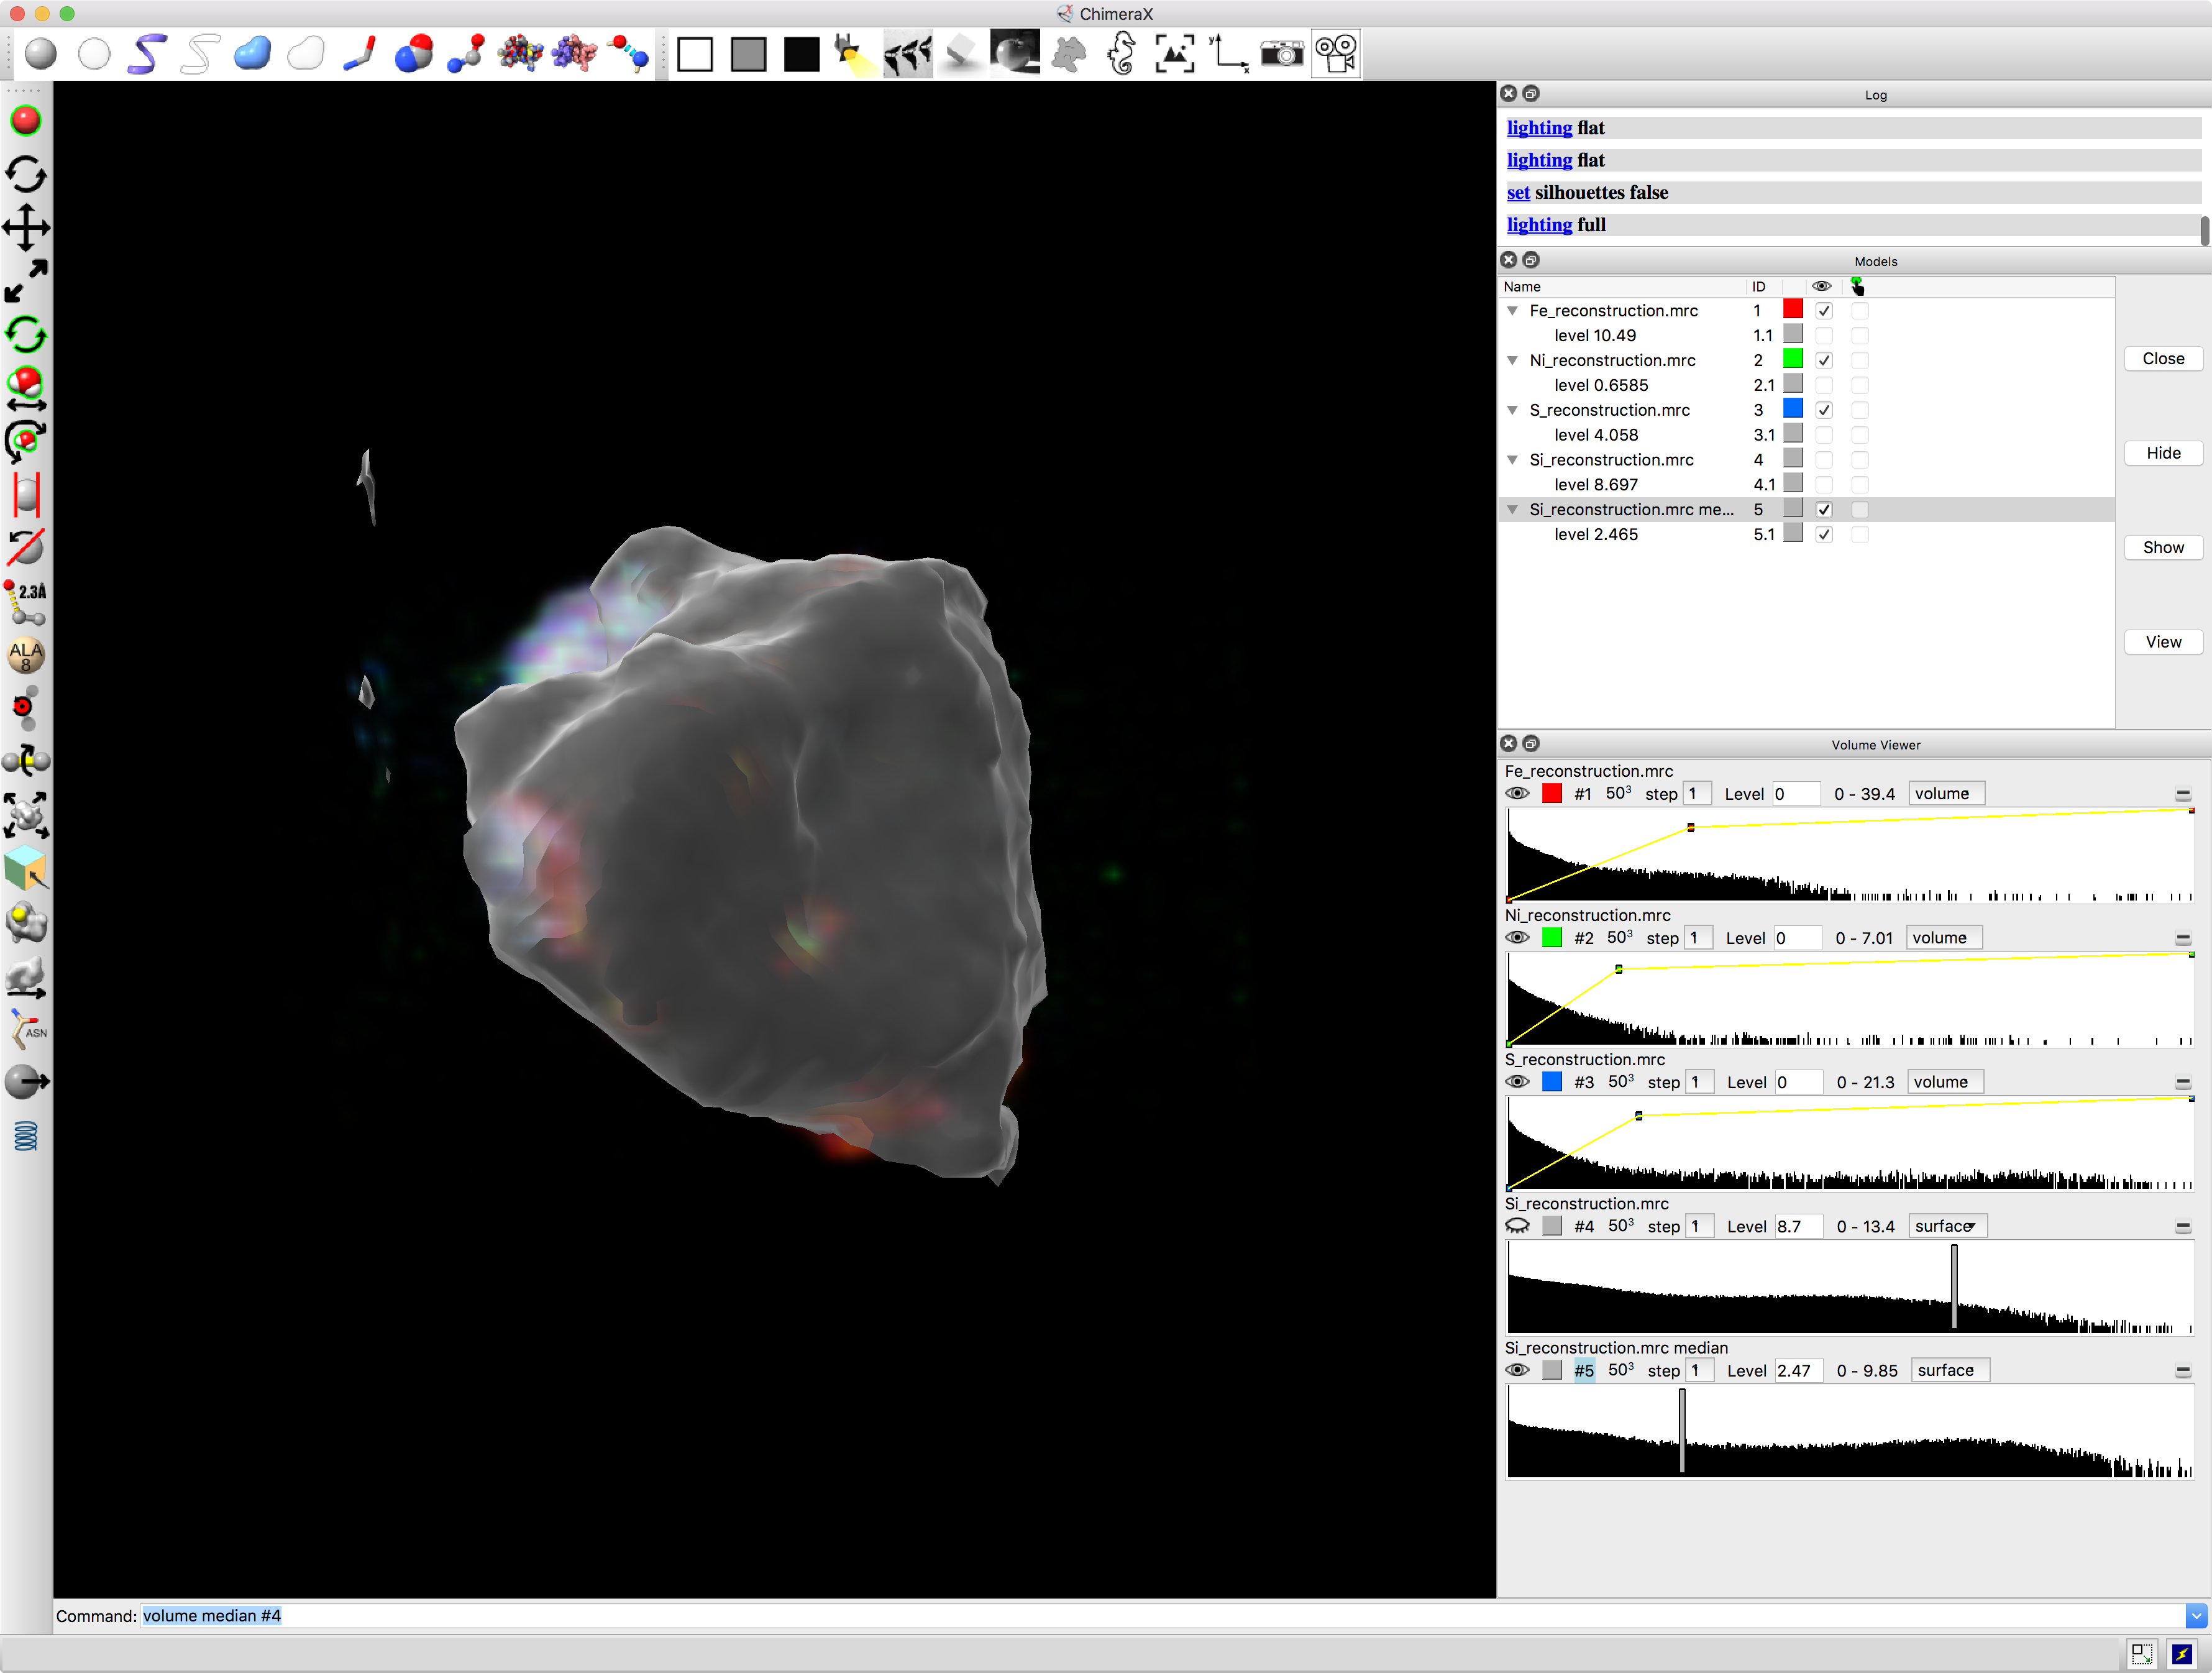
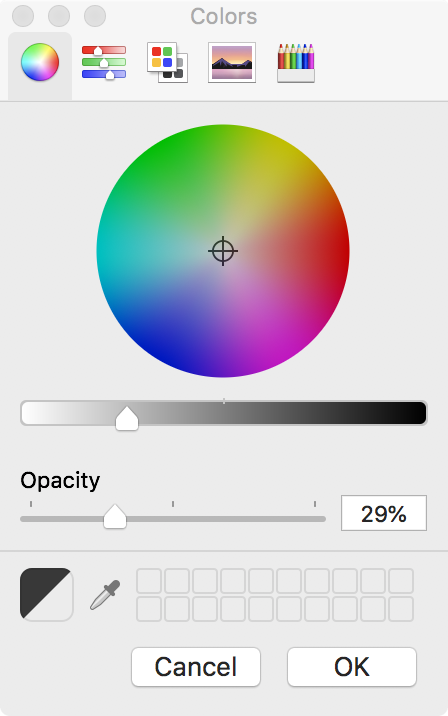
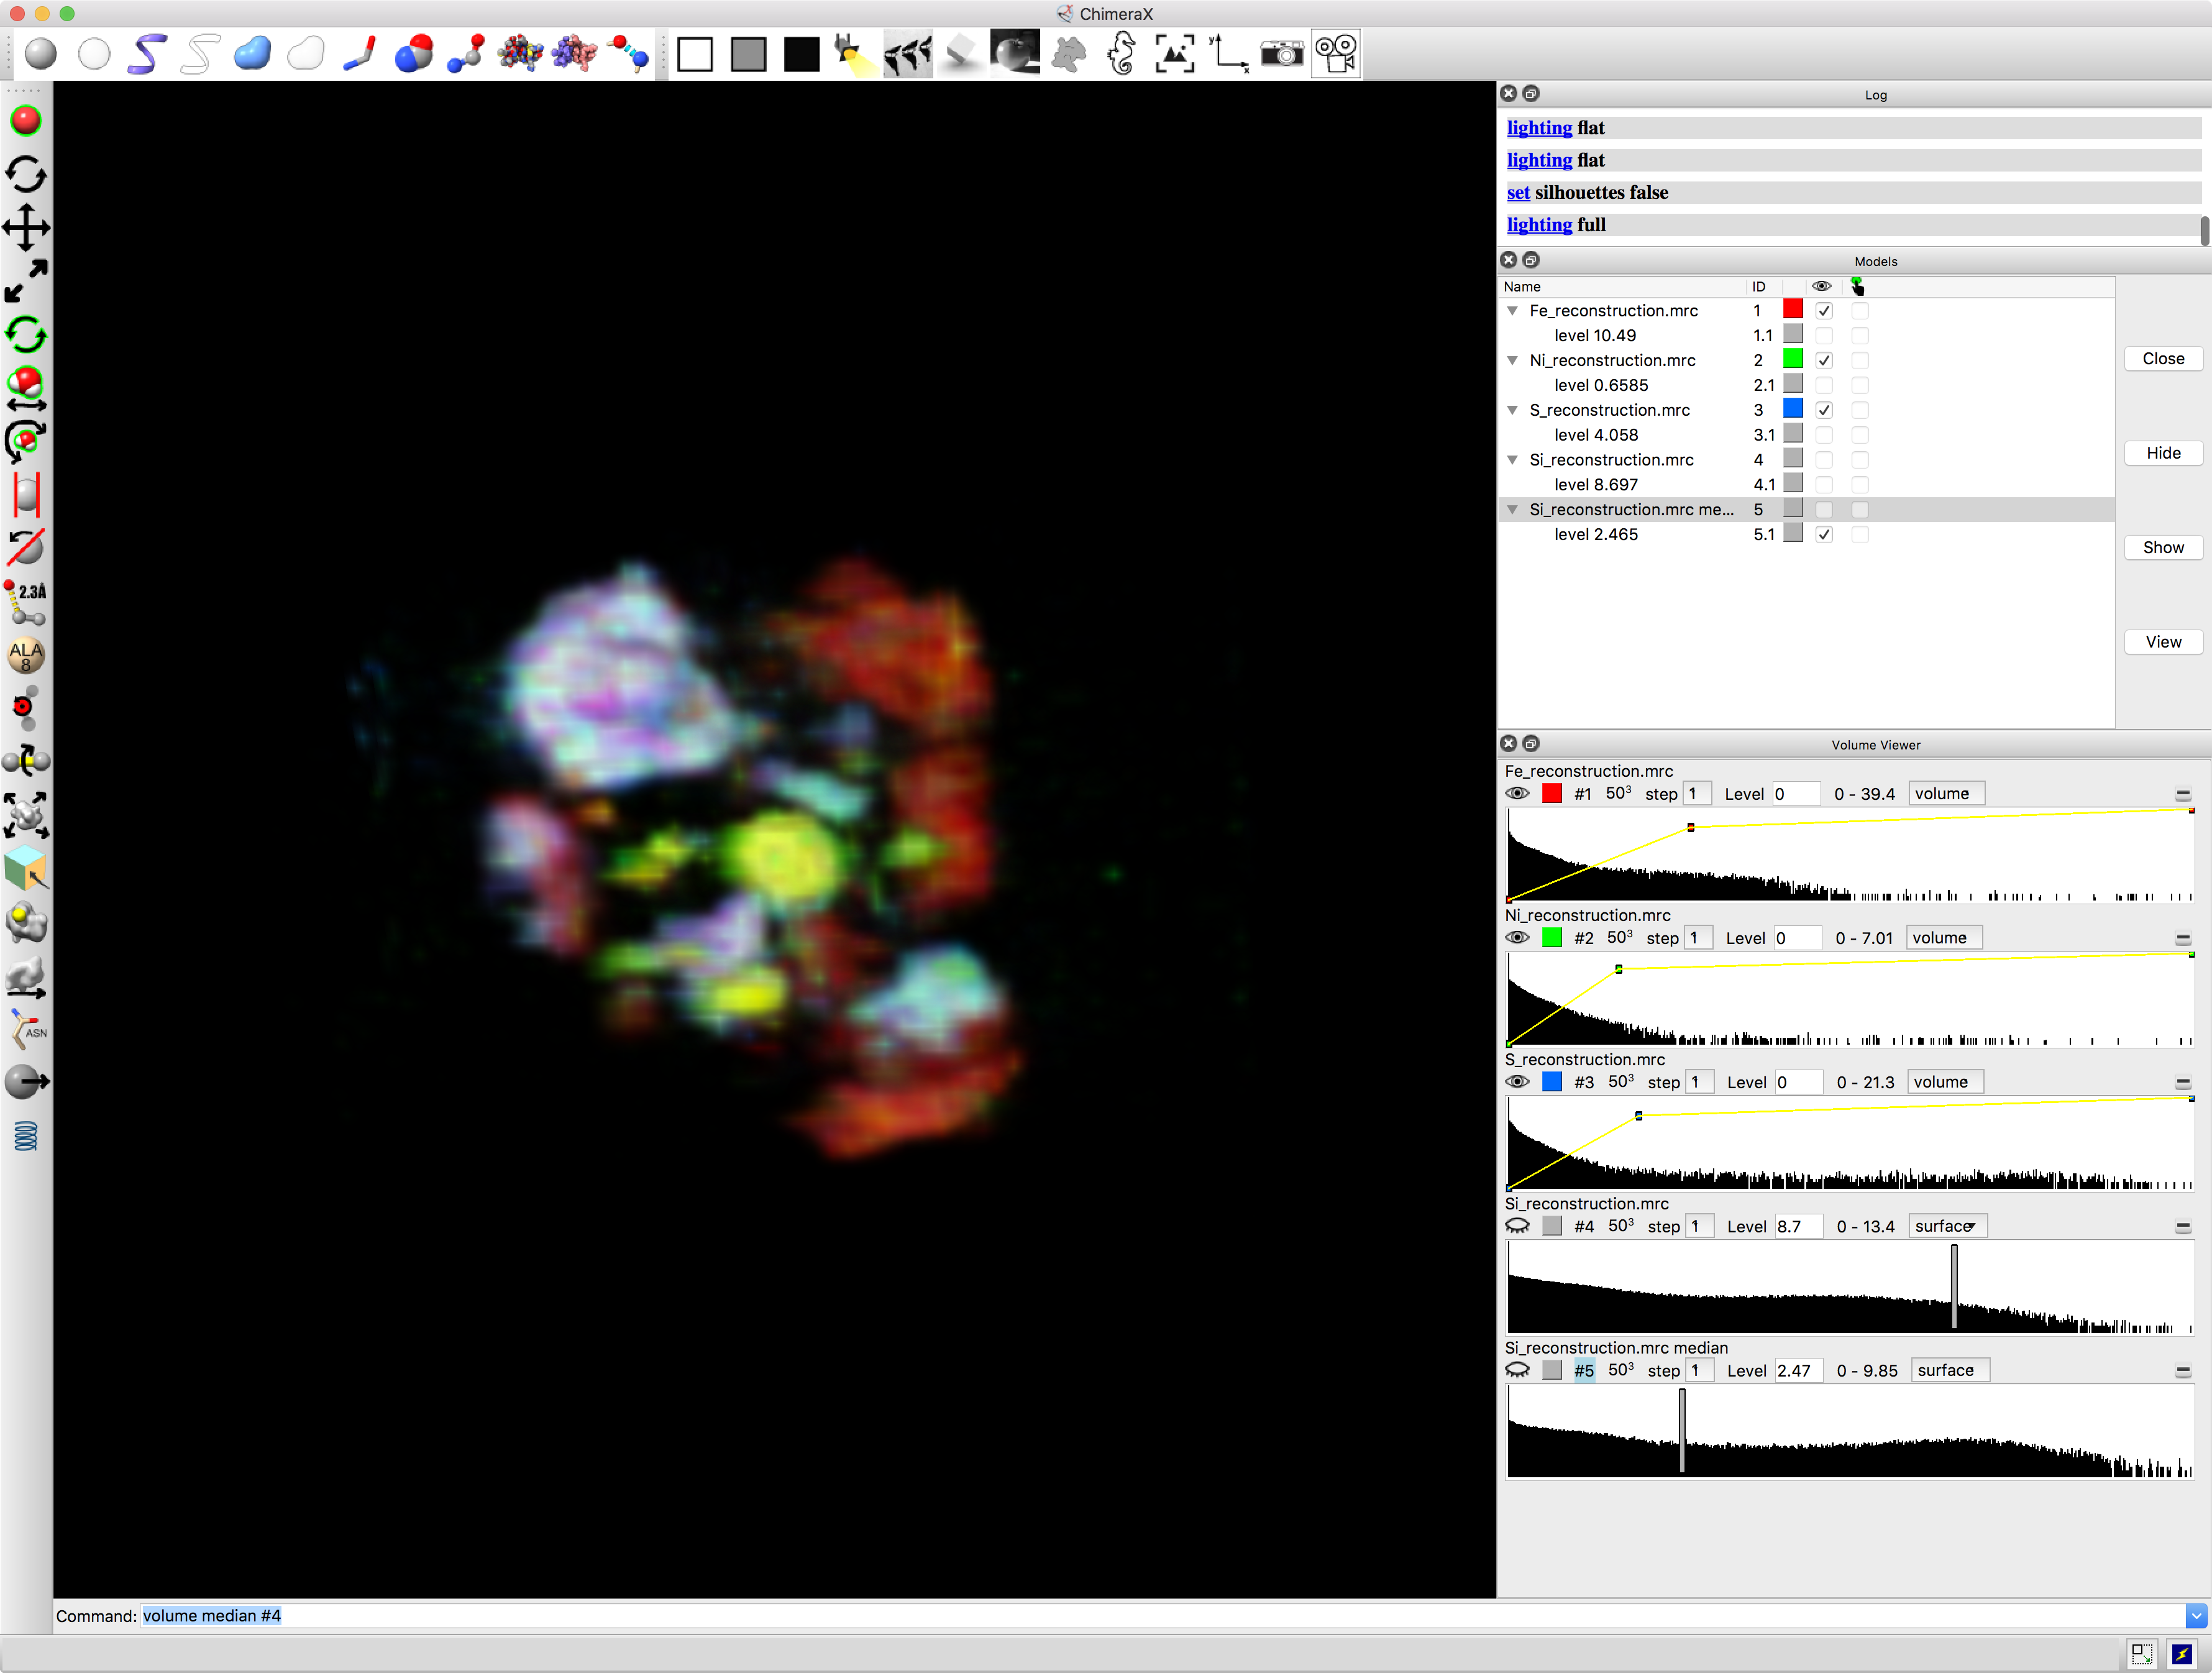
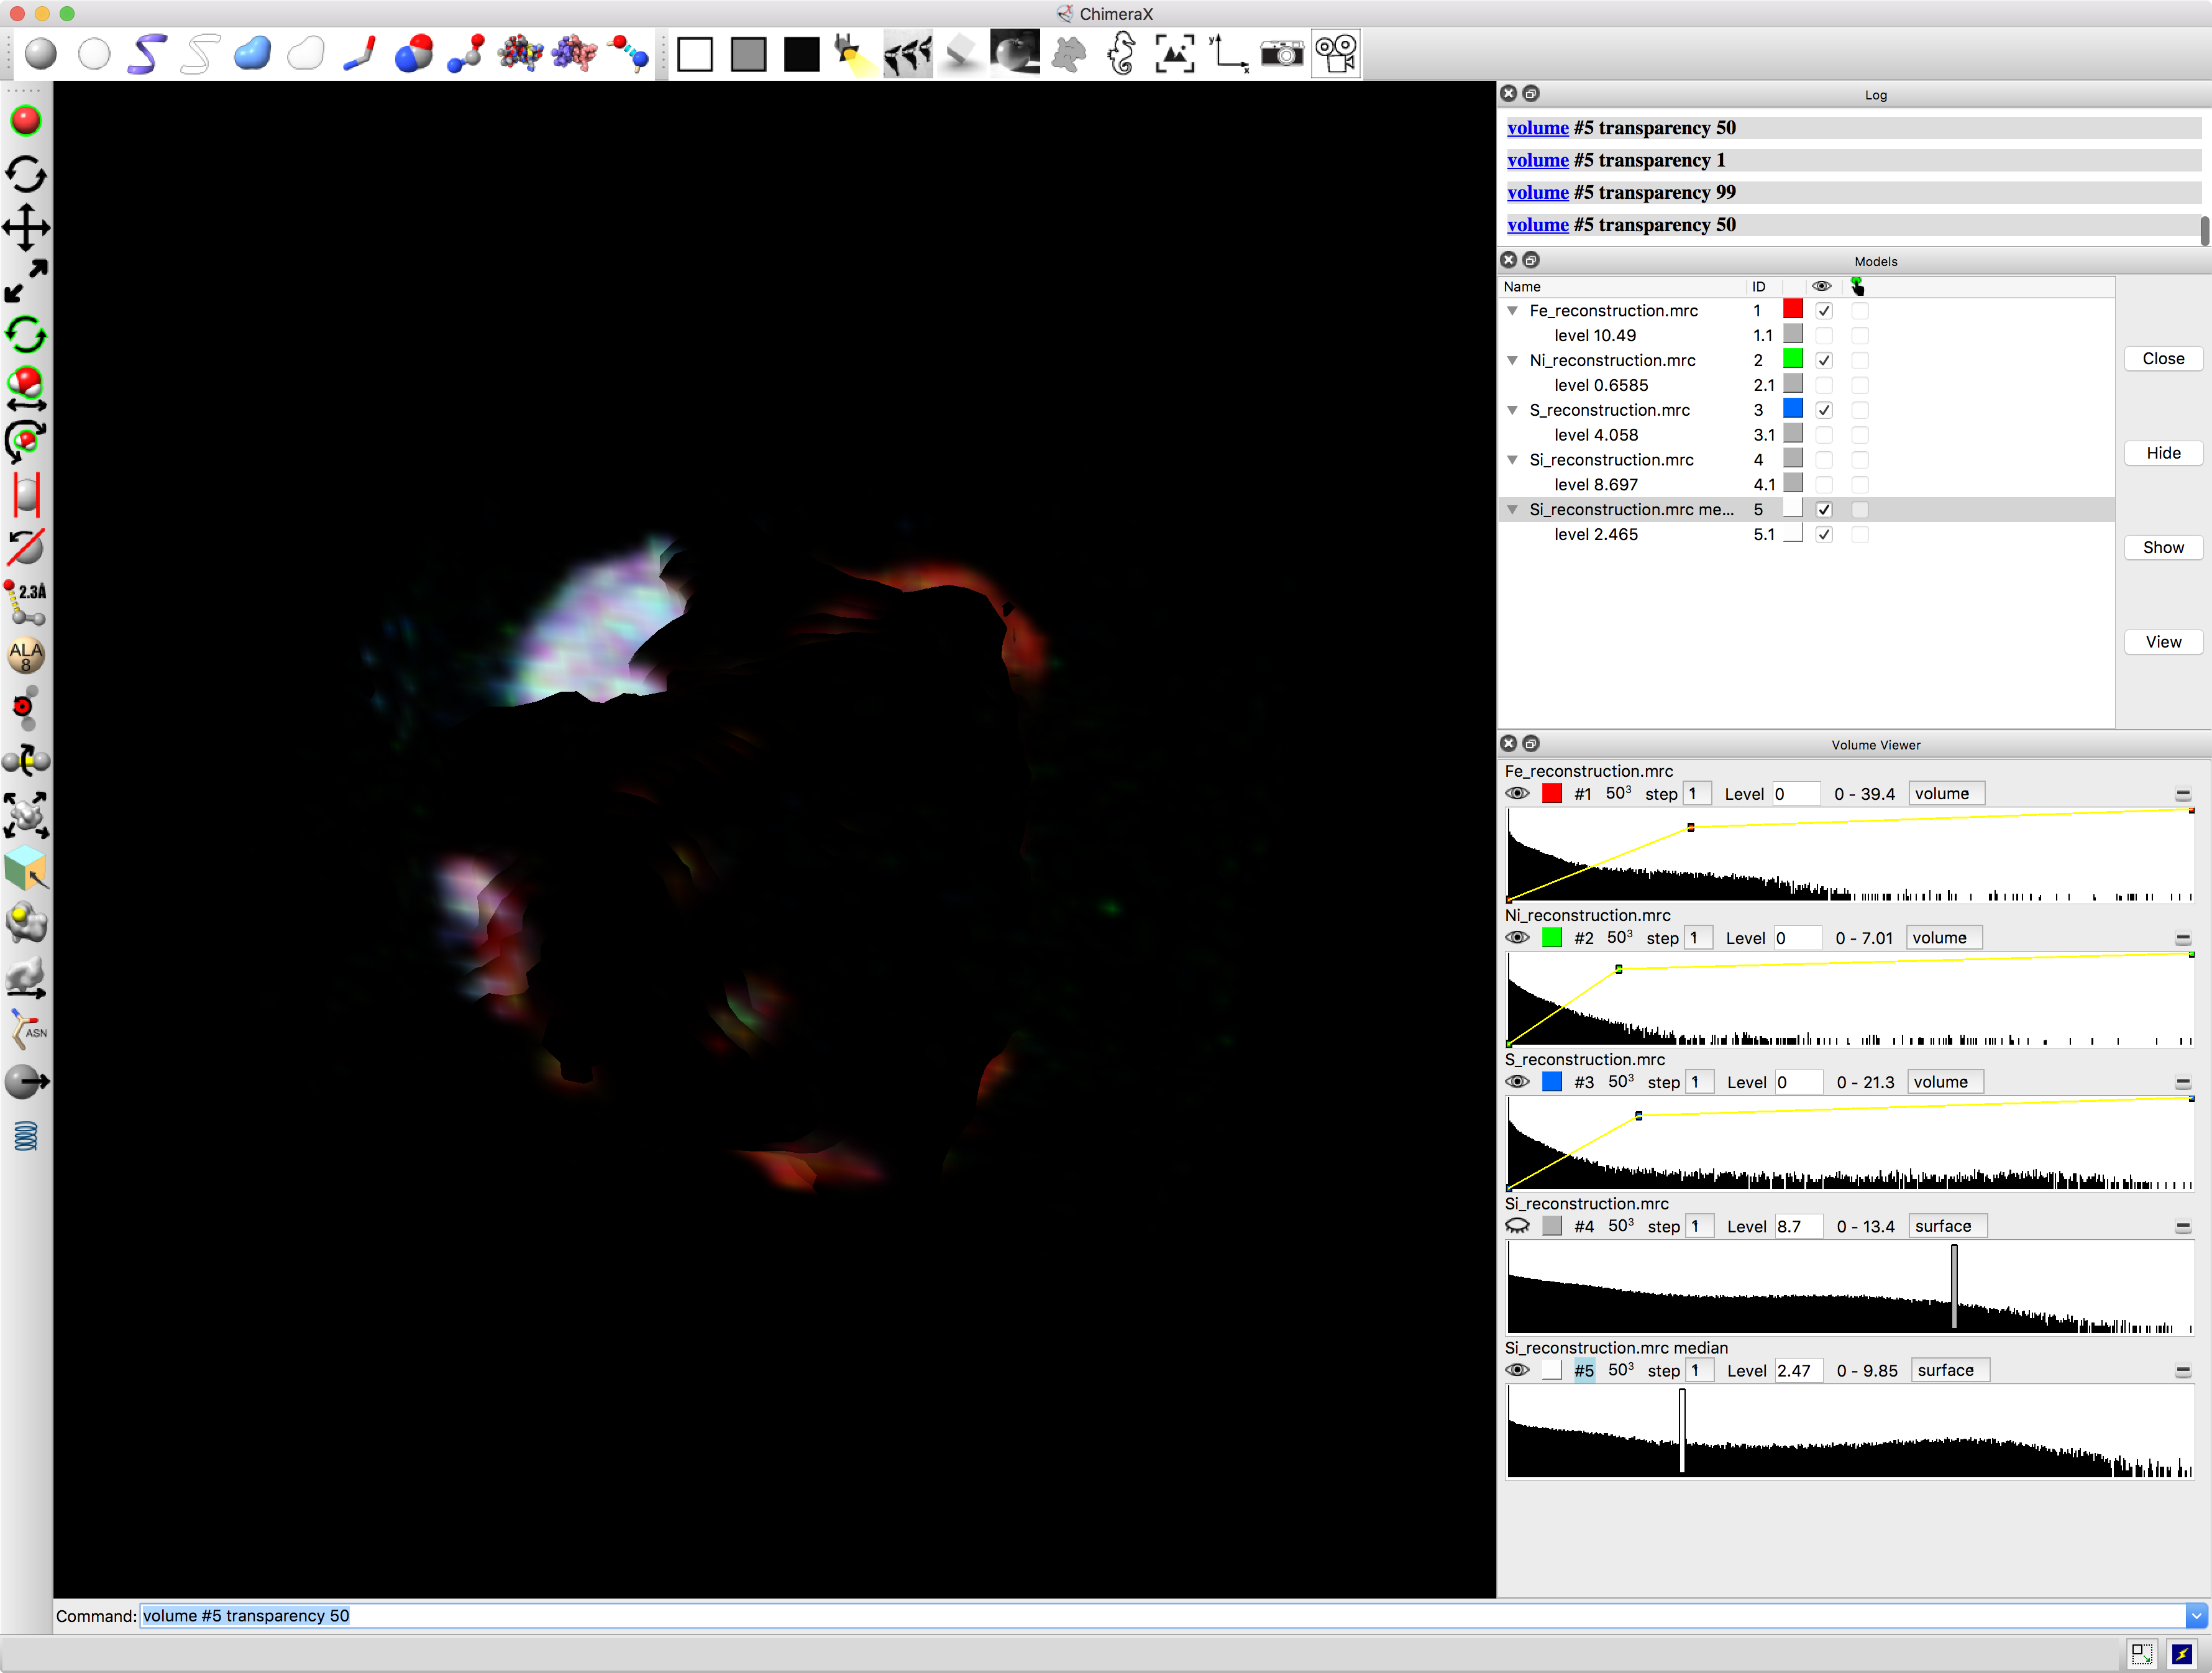
Hi, I’m fairly new to ChimeraX so forgive me if I’m a bit ignorant in this question. I have volumes acquired by tomographic reconstruction of STEM/EDS data (elemental composition in an electron microscope). I want to visualize several elements together as different colors representing phases. In some cases, the boundary is fairly obvious and can be represented with an isosurface. When I try to set the transparency of the isosurface so I can see the objects inside it, it simply turns darker color rather than transparent. As an example, here is a silicon isosurface obscuring the other volumes inside it: I’m setting the transparency using the colors dialog box: For comparison, if I make the isosurface invisible to show the objects inside: If instead I use the transparency command: volume #5 transparency 50 The isosurface turns black: My question is: am I doing this incorrectly? Thanks, Zack Gainsforth Space Sciences Laboratory, UC Berkeley 7 Gauss Way Berkeley, CA 94720 zackg@ssl.berkeley.edu