
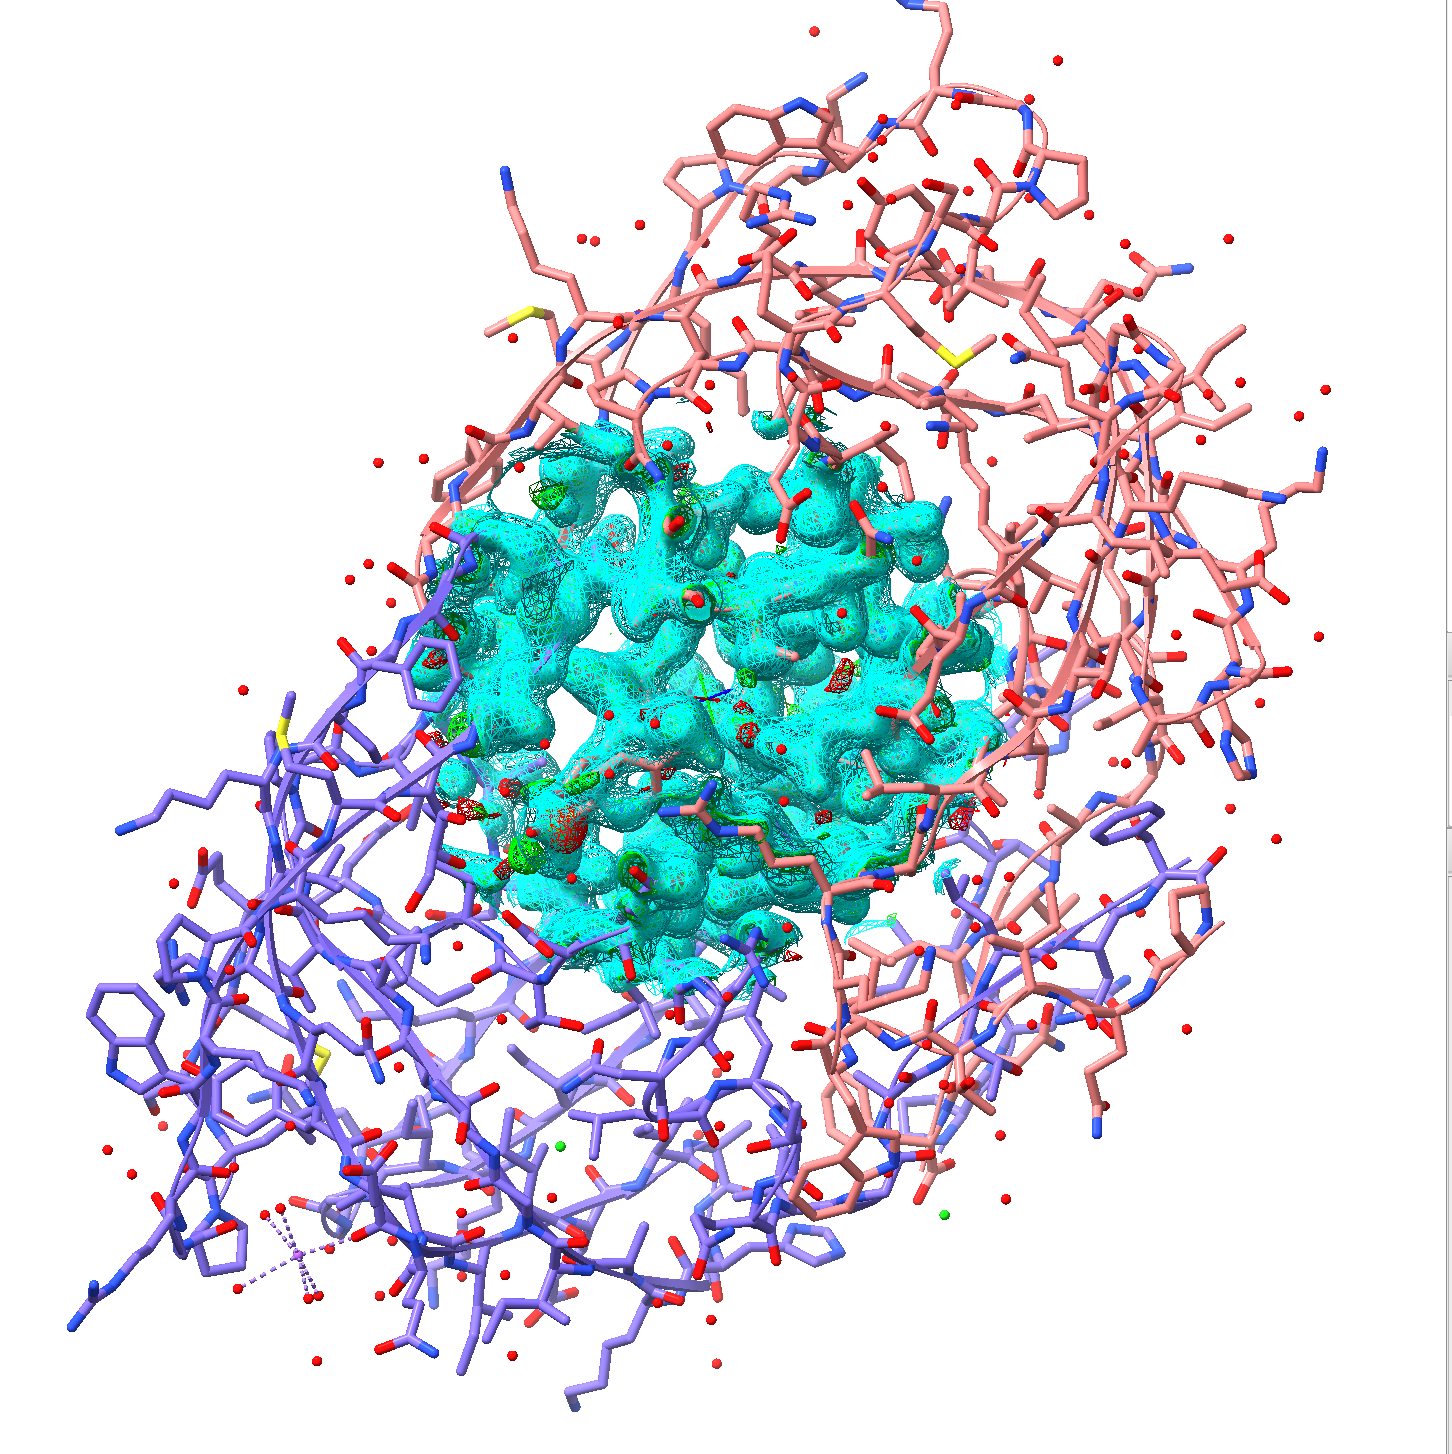
Hi folks, I recently installed Clipper, and on loading some example PDB and MTZ data, I'm seeing just a sphere of density data that does not cover the full protein model. This behaviour is not restricted to a single example. Is it expected? The example files I used are in 6DIL <https://www.rcsb.org/structure/6DIL>. I downloaded "PDB Format" and "Map Coefficients (MTZ Format)" from the drop-down menu. Loading the PDB by drag-and-drop into ChimeraX works as expected (coordinates do show). On loading the MTZ by drag-and-drop, and selecting the PDB model to import data into, I see the below representation. The density does not cover the full set of protein coordinates - it's limited to a sphere within the protein. Curiously, I saw this on coot too - so maybe I'm just getting the options incorrect? I did try shifting the cutoffs in the "Volume Viewer" Tool, and the mesh does change but it's still limited to this sphere. Changing from a mesh surface to "Maximum" shows that the available data is limited to a cube that does not cover the protein. Is there a way to view the full density? Out of interest, I also tried generating the mesh myself, but only got halfway. This at least shows that the data does cover the whole protein: import gemmi import numpy as np import meshplot as mp from skimage.measure import marching_cubes #run 'gemmi mtz2cif 6dil_phases.mtz 6dil_phases.cif' first doc = gemmi.cif.read('/Users/ljmartin/Desktop/6dil_phases.cif') rblocks = gemmi.as_refln_blocks(doc) rblock = rblocks[0] size = rblock.get_size_for_hkl(sample_rate=2.6) full = rblock.get_f_phi_on_grid('pdbx_FWT', 'pdbx_PHWT', size) array = np.array(full, copy=False) complex_map = np.fft.ifftn(array.conj()) scale_factor = complex_map.size / full.unit_cell.volume real_map = np.real(complex_map) * scale_factor v,f,n,_ = marching_cubes(real_map, 0.05) mp.plot(v, f)