
Dear ChimeraX team, I am colouring a PAE plot from a predicted multiprotein structure. From: https://www.cgl.ucsf.edu/chimerax/docs/user/tools/alphafold.html *Color plot from structure – color the plot to match the 3D structure where the pair of entities represented by an X,Y point have the same ribbon color; show the rest of the plot in shades of gray* I would like to use the correct values of the *shades of grey* to make a legend for the plot. Is there a way to see these? Is it possible to include the used palette info on the page above (as for rainbow and green)? Ideally, I would also like to change these shades of grey to have something a bit "steeper" (for example: 0 black, dark grey 5, grey 10, light grey 15, white 30). Is this already possible, or can it be added as a new palette or -ideally- as a customisable feature? Thanks a million! Pim

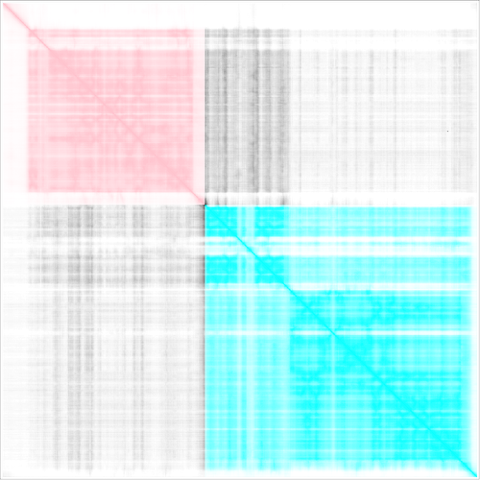
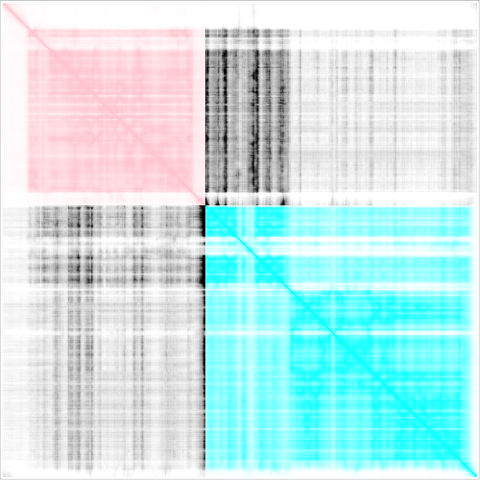
Hi Pim, When you use PAE plot context menu entry "Color plot from structure", the PAE plot for position (res1, res2) becomes the color of the structure ribbon modulated by the PAE value if res1 and res2 have the same ribbon color, otherwise a gray color is used were PAE 0 = black and PAE 30 = white and in between the square of PAE value maps to a linear black-white range. The modulation of the ribbon color fades the ribbon color to white using the square of the PAE value with PAE 0 producing the same color as the ribbon and PAE 30 producing white. There is no command to control how the ribbon or black color (for residues with differing ribbon colors) gets modulated. But you can do it by editing the ChimeraX Python code in your distribution. For instance in I modified file (in Mac ChimeraX) ChimeraX.app/Contents/lib/python3.11/site-packages/chimerax/alphafold/pae.py changing the _block_colormap() function from def _block_colormap(self, color, bg_color = (255,255,255,255)): from numpy import array, float32, linspace, sqrt pae_range = (0, 5, 10, 15, 20, 25, 30) ... to def _block_colormap(self, color, bg_color = (255,255,255,255)): from numpy import array, float32, linspace, sqrt pae_range = (0, 5, 10, 15, 20, 25, 30) if color == (0,0,0,255): pae_range = (15, 20, 25, 30) ... Which says for the black color (rgba color = (0,0,0,255)) change the PAE range for the square modulation from 0-30 to 15-30. That will make PAE values < 15 all black. If you leave out the "if color == (0,0,0,255) part then both the ribbon colors and the black color will get your new pae_range modulation. After making this code change you have to restart ChimeraX to use it. Also on current macOS I think security rules will prevent you from modifying the code, but you can use Mac system settings Privacy & Security / Full Disk Access and enable access for whatever text editor you use to modify the Python file. For a presentation image you may find it easier to just use a photo editing program, (e.g. Gimp or Photoshop) to change the contrast. Tom Here is what the above change did to an example PAE plot (P29474), left original, right modified. 
On Mar 18, 2026, at 11:35 PM, Pim Huis in 't Veld via ChimeraX-users <chimerax-users@cgl.ucsf.edu> wrote:
Dear ChimeraX team,
I am colouring a PAE plot from a predicted multiprotein structure.
From: https://www.cgl.ucsf.edu/chimerax/docs/user/tools/alphafold.html Color plot from structure – color the plot to match the 3D structure where the pair of entities represented by an X,Y point have the same ribbon color; show the rest of the plot in shades of gray
I would like to use the correct values of the shades of grey to make a legend for the plot. Is there a way to see these? Is it possible to include the used palette info on the page above (as for rainbow and green)?
Ideally, I would also like to change these shades of grey to have something a bit "steeper" (for example: 0 black, dark grey 5, grey 10, light grey 15, white 30). Is this already possible, or can it be added as a new palette or -ideally- as a customisable feature?
Thanks a million! Pim
_______________________________________________ ChimeraX-users mailing list -- chimerax-users@cgl.ucsf.edu To unsubscribe send an email to chimerax-users-leave@cgl.ucsf.edu Archives: https://mail.cgl.ucsf.edu/mailman/archives/list/chimerax-users@cgl.ucsf.edu/
participants (2)
-
 Pim Huis in 't Veld
 -
 Tom Goddard