Generating quantitative values for electrostatic potential and molecular lipophilicity potential

Dear Sir/Madam, I hope this message finds you well. My name is Ananya, and I am an undergraduate student working on a project analysing protein structures. I am currently exploring the tools available in ChimeraX to measure structural parameters of protein models. I find the visualization features for surface electrostatic potential and molecular lipophilicity potential especially valuable for my research, as they provide essential insights for my analyses. However, I have encountered some difficulty in locating a way to export quantitative values for these surface properties. Could you please advise if there is a method within ChimeraX to generate and export these values? Thank you for your time and I would greatly appreciate any guidance you could offer. Hope you have a great day ahead! Best regards, Ananya

Dear Ananya, These features are meant for visual analysis, such as for understanding the general properties of binding sites for comparison between similar structures. As such, the exact quantities are generally not that meaningful and you may be overestimating their relevance. The values are calculated on a 3D grid of points. What you see on the surface coloring is just interpolated values from the grid to the surface points (sometimes projected away from the surface rather than exactly at the surface (see the "offset" parameter of "coulombic" command), and mapped to the colors. <https://rbvi.ucsf.edu/chimerax/docs/user/commands/coulombic.html> Given this explanation that the specific values may not be that meaningful, with the "coulombic" (electrostatic coloring) command, you can create the grid as a separate volume model with the "map true" option: <https://rbvi.ucsf.edu/chimerax/docs/user/commands/coulombic.html#map-options> Then you can save the map (volume model) with the "save" command: <https://rbvi.ucsf.edu/chimerax/docs/user/commands/save.html#map> Similarly, the "mlp" command (lipophilicity coloring) also has a "map true" option: <https://rbvi.ucsf.edu/chimerax/docs/user/commands/mlp.html> Again, these are just the values on a regularly spaced 3D grid and not the values on the surface of the molecule. The only way I can think of to get the values on the surface of the molecule (which will again be very many points and very many values) is with several additional steps: (1) with the map model still open (created with "map true" option of either command), you would need to color the surface again using the Surface Color tool (menu: Tools... Volume Data... Surface Color) <https://rbvi.ucsf.edu/chimerax/docs/user/tools/surfacecolor.html> (2) in that tool, of course you need to color the molecular surface of interest by that map model (3) in that tool, click Options and turn on "Report value at mouse position" .... and that will give a pop-up balloon reporting the value at the surface point where you put the mouse. Of course, that is only one point and there are probably thousands on your molecular surface. <https://mail.cgl.ucsf.edu/mailman/archives/list/chimerax-users@cgl.ucsf.edu/...> Again, the coloring you got in the first place (without using Surface Color) is the best way to understand the distribution of values on the surface. I hope this clarifies the situation, Elaine ----- Elaine C. Meng, Ph.D. UCSF Chimera(X) team Resource for Biocomputing, Visualization, and Informatics Department of Pharmaceutical Chemistry University of California, San Francisco
On Nov 2, 2024, at 10:12 PM, mishra.ananya.163--- via ChimeraX-users <chimerax-users@cgl.ucsf.edu> wrote:
Dear Sir/Madam,
I hope this message finds you well.
My name is Ananya, and I am an undergraduate student working on a project analysing protein structures. I am currently exploring the tools available in ChimeraX to measure structural parameters of protein models. I find the visualization features for surface electrostatic potential and molecular lipophilicity potential especially valuable for my research, as they provide essential insights for my analyses.
However, I have encountered some difficulty in locating a way to export quantitative values for these surface properties. Could you please advise if there is a method within ChimeraX to generate and export these values?
Thank you for your time and I would greatly appreciate any guidance you could offer. Hope you have a great day ahead!
Best regards, Ananya

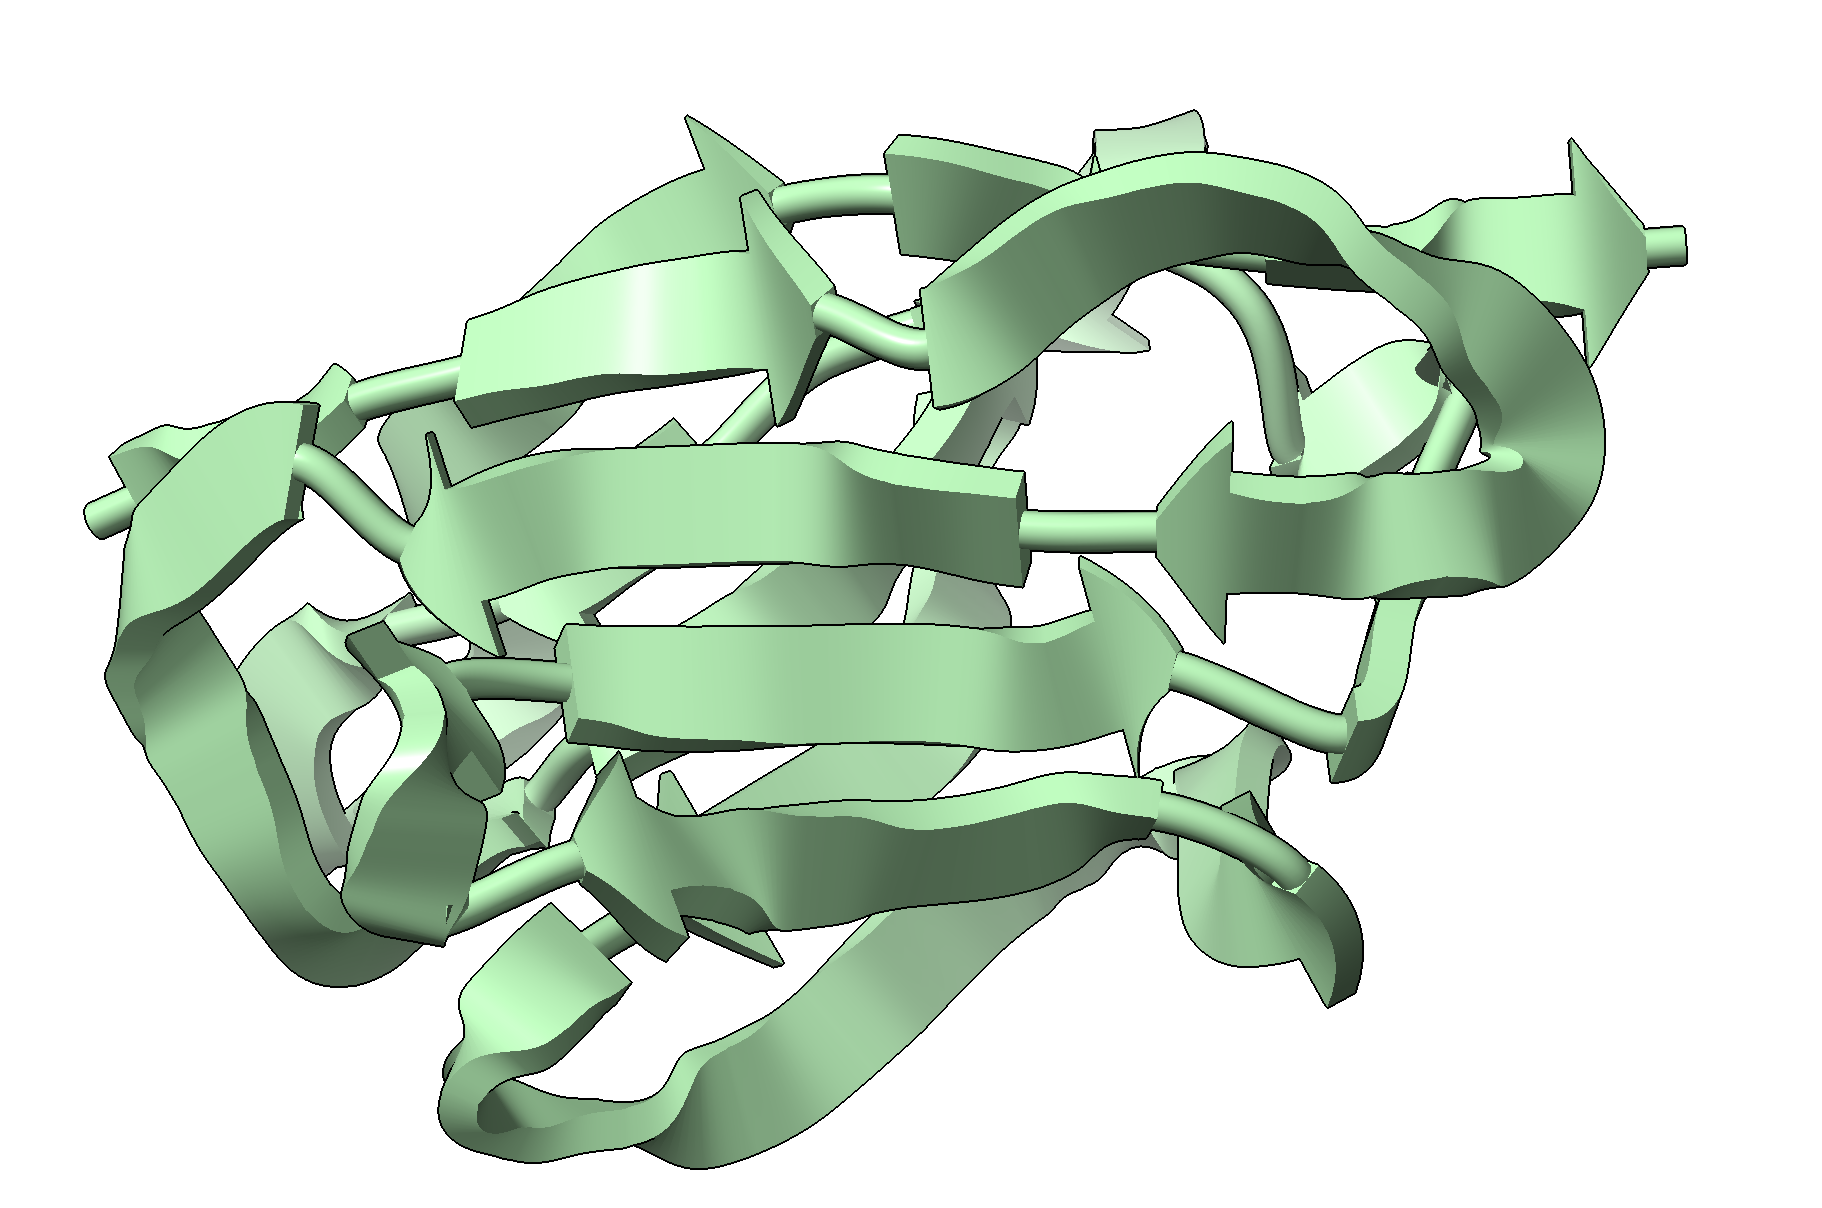
Hi Team, I want to define the secondary structure assignment on an immunoglobulin domain (C chain) using setattr /C:some-selection res ss_type 2 However ChimeraX refuses to represent a few residues within the selection as strands. This is also the case if, for instance, if I try setattr /C: res ss_type 2 Most residues are shown as strands (even some which clearly are coiled, see below, the loops) but *some* residues are still shown as coiled (even inside a strand). [cid:image001.png@01DB2EC0.1E7E3DF0] Any reason for this ? Can I overcome it ? Thanks a lot Cedric Prof. Cedric Govaerts, Ph.D. Universite Libre de Bruxelles Campus Plaine. Phone :+32 2 650 53 77<tel:+3226505377> Building BC, Room 1C4 203 Boulevard du Triomphe, Acces 2 1050 Brussels Belgium http://govaertslab.ulb.ac.be/ From: Elaine Meng via ChimeraX-users <chimerax-users@cgl.ucsf.edu> Date: Sunday, 3 November 2024 at 18:33 To: mishra.ananya.163@gmail.com <mishra.ananya.163@gmail.com> Cc: chimerax-users@cgl.ucsf.edu <chimerax-users@cgl.ucsf.edu> Subject: [chimerax-users] Re: Generating quantitative values for electrostatic potential and molecular lipophilicity potential Dear Ananya, These features are meant for visual analysis, such as for understanding the general properties of binding sites for comparison between similar structures. As such, the exact quantities are generally not that meaningful and you may be overestimating their relevance. The values are calculated on a 3D grid of points. What you see on the surface coloring is just interpolated values from the grid to the surface points (sometimes projected away from the surface rather than exactly at the surface (see the "offset" parameter of "coulombic" command), and mapped to the colors. <https://eur01.safelinks.protection.outlook.com/?url=https%3A%2F%2Frbvi.ucsf.edu%2Fchimerax%2Fdocs%2Fuser%2Fcommands%2Fcoulombic.html&data=05%7C02%7Ccedric.govaerts%40ulb.be%7C7cdd38f469db4eab32fb08dcfc2d9f29%7C30a5145e75bd4212bb028ff9c0ea4ae9%7C0%7C0%7C638662520099727971%7CUnknown%7CTWFpbGZsb3d8eyJWIjoiMC4wLjAwMDAiLCJQIjoiV2luMzIiLCJBTiI6Ik1haWwiLCJXVCI6Mn0%3D%7C0%7C%7C%7C&sdata=gej%2FSNg%2F0Aqj1sFEUqgHB7F%2BKExYkBdnmjXYgJvu2tY%3D&reserved=0<https://rbvi.ucsf.edu/chimerax/docs/user/commands/coulombic.html>> Given this explanation that the specific values may not be that meaningful, with the "coulombic" (electrostatic coloring) command, you can create the grid as a separate volume model with the "map true" option: <https://eur01.safelinks.protection.outlook.com/?url=https%3A%2F%2Frbvi.ucsf.edu%2Fchimerax%2Fdocs%2Fuser%2Fcommands%2Fcoulombic.html%23map-options&data=05%7C02%7Ccedric.govaerts%40ulb.be%7C7cdd38f469db4eab32fb08dcfc2d9f29%7C30a5145e75bd4212bb028ff9c0ea4ae9%7C0%7C0%7C638662520099758363%7CUnknown%7CTWFpbGZsb3d8eyJWIjoiMC4wLjAwMDAiLCJQIjoiV2luMzIiLCJBTiI6Ik1haWwiLCJXVCI6Mn0%3D%7C0%7C%7C%7C&sdata=Y5vUDlqVb5v%2BxBtcL88oN1yj5CObflZQxJ1XztesAYQ%3D&reserved=0<https://rbvi.ucsf.edu/chimerax/docs/user/commands/coulombic.html#map-options>> Then you can save the map (volume model) with the "save" command: <https://eur01.safelinks.protection.outlook.com/?url=https%3A%2F%2Frbvi.ucsf.edu%2Fchimerax%2Fdocs%2Fuser%2Fcommands%2Fsave.html%23map&data=05%7C02%7Ccedric.govaerts%40ulb.be%7C7cdd38f469db4eab32fb08dcfc2d9f29%7C30a5145e75bd4212bb028ff9c0ea4ae9%7C0%7C0%7C638662520099774701%7CUnknown%7CTWFpbGZsb3d8eyJWIjoiMC4wLjAwMDAiLCJQIjoiV2luMzIiLCJBTiI6Ik1haWwiLCJXVCI6Mn0%3D%7C0%7C%7C%7C&sdata=yDVv2jbh2h0I0ddPg65rnz0is2jFgDmB%2BMhorqhmbPU%3D&reserved=0<https://rbvi.ucsf.edu/chimerax/docs/user/commands/save.html#map>> Similarly, the "mlp" command (lipophilicity coloring) also has a "map true" option: <https://eur01.safelinks.protection.outlook.com/?url=https%3A%2F%2Frbvi.ucsf.edu%2Fchimerax%2Fdocs%2Fuser%2Fcommands%2Fmlp.html&data=05%7C02%7Ccedric.govaerts%40ulb.be%7C7cdd38f469db4eab32fb08dcfc2d9f29%7C30a5145e75bd4212bb028ff9c0ea4ae9%7C0%7C0%7C638662520099790621%7CUnknown%7CTWFpbGZsb3d8eyJWIjoiMC4wLjAwMDAiLCJQIjoiV2luMzIiLCJBTiI6Ik1haWwiLCJXVCI6Mn0%3D%7C0%7C%7C%7C&sdata=O2ZKnktcLDz8ccfsVabMiKuQUhbGxqogc5u%2FepDPT%2Fw%3D&reserved=0<https://rbvi.ucsf.edu/chimerax/docs/user/commands/mlp.html>> Again, these are just the values on a regularly spaced 3D grid and not the values on the surface of the molecule. The only way I can think of to get the values on the surface of the molecule (which will again be very many points and very many values) is with several additional steps: (1) with the map model still open (created with "map true" option of either command), you would need to color the surface again using the Surface Color tool (menu: Tools... Volume Data... Surface Color) <https://eur01.safelinks.protection.outlook.com/?url=https%3A%2F%2Frbvi.ucsf.edu%2Fchimerax%2Fdocs%2Fuser%2Ftools%2Fsurfacecolor.html&data=05%7C02%7Ccedric.govaerts%40ulb.be%7C7cdd38f469db4eab32fb08dcfc2d9f29%7C30a5145e75bd4212bb028ff9c0ea4ae9%7C0%7C0%7C638662520099806440%7CUnknown%7CTWFpbGZsb3d8eyJWIjoiMC4wLjAwMDAiLCJQIjoiV2luMzIiLCJBTiI6Ik1haWwiLCJXVCI6Mn0%3D%7C0%7C%7C%7C&sdata=0BAqlg1s5TyE0Y%2FF3p3lCOgDDqf6WmyTz4%2BqqfBihD8%3D&reserved=0<https://rbvi.ucsf.edu/chimerax/docs/user/tools/surfacecolor.html>> (2) in that tool, of course you need to color the molecular surface of interest by that map model (3) in that tool, click Options and turn on "Report value at mouse position" .... and that will give a pop-up balloon reporting the value at the surface point where you put the mouse. Of course, that is only one point and there are probably thousands on your molecular surface. <https://eur01.safelinks.protection.outlook.com/?url=https%3A%2F%2Fmail.cgl.ucsf.edu%2Fmailman%2Farchives%2Flist%2Fchimerax-users%40cgl.ucsf.edu%2Fmessage%2FDC7U2AFCJEYNE4QFXWOI6ZX4MYXD435A%2F&data=05%7C02%7Ccedric.govaerts%40ulb.be%7C7cdd38f469db4eab32fb08dcfc2d9f29%7C30a5145e75bd4212bb028ff9c0ea4ae9%7C0%7C0%7C638662520099821751%7CUnknown%7CTWFpbGZsb3d8eyJWIjoiMC4wLjAwMDAiLCJQIjoiV2luMzIiLCJBTiI6Ik1haWwiLCJXVCI6Mn0%3D%7C0%7C%7C%7C&sdata=waNQbkBpp6KLqWyHNPTTsMtDUbxAh5q%2F9oFoylhbhPo%3D&reserved=0<https://mail.cgl.ucsf.edu/mailman/archives/list/chimerax-users@cgl.ucsf.edu/message/DC7U2AFCJEYNE4QFXWOI6ZX4MYXD435A/>> Again, the coloring you got in the first place (without using Surface Color) is the best way to understand the distribution of values on the surface. I hope this clarifies the situation, Elaine ----- Elaine C. Meng, Ph.D. UCSF Chimera(X) team Resource for Biocomputing, Visualization, and Informatics Department of Pharmaceutical Chemistry University of California, San Francisco
On Nov 2, 2024, at 10:12 PM, mishra.ananya.163--- via ChimeraX-users <chimerax-users@cgl.ucsf.edu> wrote:
Dear Sir/Madam,
I hope this message finds you well.
My name is Ananya, and I am an undergraduate student working on a project analysing protein structures. I am currently exploring the tools available in ChimeraX to measure structural parameters of protein models. I find the visualization features for surface electrostatic potential and molecular lipophilicity potential especially valuable for my research, as they provide essential insights for my analyses.
However, I have encountered some difficulty in locating a way to export quantitative values for these surface properties. Could you please advise if there is a method within ChimeraX to generate and export these values?
Thank you for your time and I would greatly appreciate any guidance you could offer. Hope you have a great day ahead!
Best regards, Ananya
_______________________________________________ ChimeraX-users mailing list -- chimerax-users@cgl.ucsf.edu To unsubscribe send an email to chimerax-users-leave@cgl.ucsf.edu Archives: https://eur01.safelinks.protection.outlook.com/?url=https%3A%2F%2Fmail.cgl.ucsf.edu%2Fmailman%2Farchives%2Flist%2Fchimerax-users%40cgl.ucsf.edu%2F&data=05%7C02%7Ccedric.govaerts%40ulb.be%7C7cdd38f469db4eab32fb08dcfc2d9f29%7C30a5145e75bd4212bb028ff9c0ea4ae9%7C0%7C0%7C638662520099837007%7CUnknown%7CTWFpbGZsb3d8eyJWIjoiMC4wLjAwMDAiLCJQIjoiV2luMzIiLCJBTiI6Ik1haWwiLCJXVCI6Mn0%3D%7C0%7C%7C%7C&sdata=tRUoxnNSCDQy60i73UObL1eHwyg7uJ8QXjQZ%2BwQjVAE%3D&reserved=0<https://mail.cgl.ucsf.edu/mailman/archives/list/chimerax-users@cgl.ucsf.edu/>
Hi Cedric, ChimeraX is accepting the SS assignment, but.... In addition to secondary structure assignment, there is another attribute that indicates whether the residues are in the same secondary structure segment as each other -- for example there could be two strands immediately next to each other (which shows a connecting thin part no matter what) that is not the same as having one long strand (which would not show any thin part). See residue attribute "ss_id" in addition to "ss_type": <https://rbvi.ucsf.edu/chimerax/docs/user/attributes.html#residue> So if you want a longer set of residues to be all in the same strand (or in the same helix, same issue), you would have to also tell ChimeraX they are part of the same element by assigning them the same "ss_id" value. You can just give it some high number just to make sure it isn't the same ID as some other secondary structure element in the structure, for example: setattr /A:10-25 res ss_id 99 setattr command <https://rbvi.ucsf.edu/chimerax/docs/user/commands/setattr.html> See also previous posts <https://mail.cgl.ucsf.edu/mailman/archives/list/chimerax-users@cgl.ucsf.edu/...> <https://mail.cgl.ucsf.edu/mailman/archives/list/chimerax-users@cgl.ucsf.edu/...> I hope this helps, Elaine ----- Elaine C. Meng, Ph.D. UCSF Chimera(X) team Resource for Biocomputing, Visualization, and Informatics Department of Pharmaceutical Chemistry University of California, San Francisco
On Nov 4, 2024, at 4:49 AM, GOVAERTS Cédric <Cedric.Govaerts@ulb.be> wrote:
Hi Team, I want to define the secondary structure assignment on an immunoglobulin domain (C chain) using setattr /C:some-selection res ss_type 2 However ChimeraX refuses to represent a few residues within the selection as strands. This is also the case if, for instance, if I try setattr /C: res ss_type 2 Most residues are shown as strands (even some which clearly are coiled, see below, the loops) but *some* residues are still shown as coiled (even inside a strand).<image001.png> Any reason for this ? Can I overcome it ? Thanks a lot Cedric Prof. Cedric Govaerts, Ph.D. Universite Libre de Bruxelles Campus Plaine. Phone :+32 2 650 53 77 Building BC, Room 1C4 203 Boulevard du Triomphe, Acces 2 1050 Brussels Belgium http://govaertslab.ulb.ac.be/ From: Elaine Meng via ChimeraX-users <chimerax-users@cgl.ucsf.edu> Date: Sunday, 3 November 2024 at 18:33 To: mishra.ananya.163@gmail.com <mishra.ananya.163@gmail.com> Cc: chimerax-users@cgl.ucsf.edu <chimerax-users@cgl.ucsf.edu> Subject: [chimerax-users] Re: Generating quantitative values for electrostatic potential and molecular lipophilicity potential Dear Ananya, These features are meant for visual analysis, such as for understanding the general properties of binding sites for comparison between similar structures. As such, the exact quantities are generally not that meaningful and you may be overestimating their relevance.
The values are calculated on a 3D grid of points. What you see on the surface coloring is just interpolated values from the grid to the surface points (sometimes projected away from the surface rather than exactly at the surface (see the "offset" parameter of "coulombic" command), and mapped to the colors. <https://eur01.safelinks.protection.outlook.com/?url=https%3A%2F%2Frbvi.ucsf....>
Given this explanation that the specific values may not be that meaningful, with the "coulombic" (electrostatic coloring) command, you can create the grid as a separate volume model with the "map true" option: <https://eur01.safelinks.protection.outlook.com/?url=https%3A%2F%2Frbvi.ucsf....>
Then you can save the map (volume model) with the "save" command: <https://eur01.safelinks.protection.outlook.com/?url=https%3A%2F%2Frbvi.ucsf....>
Similarly, the "mlp" command (lipophilicity coloring) also has a "map true" option: <https://eur01.safelinks.protection.outlook.com/?url=https%3A%2F%2Frbvi.ucsf....>
Again, these are just the values on a regularly spaced 3D grid and not the values on the surface of the molecule.
The only way I can think of to get the values on the surface of the molecule (which will again be very many points and very many values) is with several additional steps:
(1) with the map model still open (created with "map true" option of either command), you would need to color the surface again using the Surface Color tool (menu: Tools... Volume Data... Surface Color) <https://eur01.safelinks.protection.outlook.com/?url=https%3A%2F%2Frbvi.ucsf....> (2) in that tool, of course you need to color the molecular surface of interest by that map model (3) in that tool, click Options and turn on "Report value at mouse position" .... and that will give a pop-up balloon reporting the value at the surface point where you put the mouse. Of course, that is only one point and there are probably thousands on your molecular surface.
<https://eur01.safelinks.protection.outlook.com/?url=https%3A%2F%2Fmail.cgl.u...>
Again, the coloring you got in the first place (without using Surface Color) is the best way to understand the distribution of values on the surface.
I hope this clarifies the situation, Elaine ----- Elaine C. Meng, Ph.D. UCSF Chimera(X) team Resource for Biocomputing, Visualization, and Informatics Department of Pharmaceutical Chemistry University of California, San Francisco
On Nov 2, 2024, at 10:12 PM, mishra.ananya.163--- via ChimeraX-users <chimerax-users@cgl.ucsf.edu> wrote:
Dear Sir/Madam,
I hope this message finds you well.
My name is Ananya, and I am an undergraduate student working on a project analysing protein structures. I am currently exploring the tools available in ChimeraX to measure structural parameters of protein models. I find the visualization features for surface electrostatic potential and molecular lipophilicity potential especially valuable for my research, as they provide essential insights for my analyses.
However, I have encountered some difficulty in locating a way to export quantitative values for these surface properties. Could you please advise if there is a method within ChimeraX to generate and export these values?
Thank you for your time and I would greatly appreciate any guidance you could offer. Hope you have a great day ahead!
Best regards, Ananya
_______________________________________________ ChimeraX-users mailing list -- chimerax-users@cgl.ucsf.edu To unsubscribe send an email to chimerax-users-leave@cgl.ucsf.edu Archives: https://eur01.safelinks.protection.outlook.com/?url=https%3A%2F%2Fmail.cgl.u...
Hi Elaine, Thanks (once more!) One follow up question : how does Chimera establish the ss_id to start with? As far as I know this was not present in the original PDB so why where there different segments in the structure ? Thanks Cedrc -----Original Message----- From: Elaine Meng <meng@cgl.ucsf.edu> Sent: Monday, 4 November 2024 17:44 To: GOVAERTS Cédric <Cedric.Govaerts@ulb.be> Cc: ChimeraX Users Help <chimerax-users@cgl.ucsf.edu> Subject: Re: ChimeraX not accepting SS assignment Hi Cedric, ChimeraX is accepting the SS assignment, but.... In addition to secondary structure assignment, there is another attribute that indicates whether the residues are in the same secondary structure segment as each other -- for example there could be two strands immediately next to each other (which shows a connecting thin part no matter what) that is not the same as having one long strand (which would not show any thin part). See residue attribute "ss_id" in addition to "ss_type": <https://rbvi.ucsf.edu/chimerax/docs/user/attributes.html#residue> So if you want a longer set of residues to be all in the same strand (or in the same helix, same issue), you would have to also tell ChimeraX they are part of the same element by assigning them the same "ss_id" value. You can just give it some high number just to make sure it isn't the same ID as some other secondary structure element in the structure, for example: setattr /A:10-25 res ss_id 99 setattr command <https://rbvi.ucsf.edu/chimerax/docs/user/commands/setattr.html> See also previous posts <https://mail.cgl.ucsf.edu/mailman/archives/list/chimerax-users@cgl.ucsf.edu/...> <https://mail.cgl.ucsf.edu/mailman/archives/list/chimerax-users@cgl.ucsf.edu/...> I hope this helps, Elaine ----- Elaine C. Meng, Ph.D. UCSF Chimera(X) team Resource for Biocomputing, Visualization, and Informatics Department of Pharmaceutical Chemistry University of California, San Francisco
On Nov 4, 2024, at 4:49 AM, GOVAERTS Cédric <Cedric.Govaerts@ulb.be> wrote:
Hi Team, I want to define the secondary structure assignment on an immunoglobulin domain (C chain) using setattr /C:some-selection res ss_type 2 However ChimeraX refuses to represent a few residues within the selection as strands. This is also the case if, for instance, if I try setattr /C: res ss_type 2 Most residues are shown as strands (even some which clearly are coiled, see below, the loops) but *some* residues are still shown as coiled (even inside a strand).<image001.png> Any reason for this ? Can I overcome it ? Thanks a lot Cedric Prof. Cedric Govaerts, Ph.D. Universite Libre de Bruxelles Campus Plaine. Phone :+32 2 650 53 77 Building BC, Room 1C4 203 Boulevard du Triomphe, Acces 2 1050 Brussels Belgium http://govaertslab.ulb.ac.be/ From: Elaine Meng via ChimeraX-users <chimerax-users@cgl.ucsf.edu> Date: Sunday, 3 November 2024 at 18:33 To: mishra.ananya.163@gmail.com <mishra.ananya.163@gmail.com> Cc: chimerax-users@cgl.ucsf.edu <chimerax-users@cgl.ucsf.edu> Subject: [chimerax-users] Re: Generating quantitative values for electrostatic potential and molecular lipophilicity potential Dear Ananya, These features are meant for visual analysis, such as for understanding the general properties of binding sites for comparison between similar structures. As such, the exact quantities are generally not that meaningful and you may be overestimating their relevance.
The values are calculated on a 3D grid of points. What you see on the surface coloring is just interpolated values from the grid to the surface points (sometimes projected away from the surface rather than exactly at the surface (see the "offset" parameter of "coulombic" command), and mapped to the colors. <https://rbv/ i.ucsf.edu%2Fchimerax%2Fdocs%2Fuser%2Fcommands%2Fcoulombic.html&data=0 5%7C02%7CCedric.Govaerts%40ulb.be%7Cc52e9f7a170c41d7d6eb08dcfcefec23%7 C30a5145e75bd4212bb028ff9c0ea4ae9%7C0%7C0%7C638663354619074316%7CUnkno wn%7CTWFpbGZsb3d8eyJWIjoiMC4wLjAwMDAiLCJQIjoiV2luMzIiLCJBTiI6Ik1haWwiL CJXVCI6Mn0%3D%7C0%7C%7C%7C&sdata=Vw0sEwE9c%2FDSBGxwBzUOtHSsxa32pF4uxmX 49qNvSh4%3D&reserved=0>
Given this explanation that the specific values may not be that meaningful, with the "coulombic" (electrostatic coloring) command, you can create the grid as a separate volume model with the "map true" option: <https://rbv/ i.ucsf.edu%2Fchimerax%2Fdocs%2Fuser%2Fcommands%2Fcoulombic.html%23map- options&data=05%7C02%7CCedric.Govaerts%40ulb.be%7Cc52e9f7a170c41d7d6eb 08dcfcefec23%7C30a5145e75bd4212bb028ff9c0ea4ae9%7C0%7C0%7C638663354619 096661%7CUnknown%7CTWFpbGZsb3d8eyJWIjoiMC4wLjAwMDAiLCJQIjoiV2luMzIiLCJ BTiI6Ik1haWwiLCJXVCI6Mn0%3D%7C0%7C%7C%7C&sdata=XdSk7Js6sklZTfcwTwka6gE hvcbkTDpPhfbyBmrVkqY%3D&reserved=0>
Then you can save the map (volume model) with the "save" command: <https://rbv/ i.ucsf.edu%2Fchimerax%2Fdocs%2Fuser%2Fcommands%2Fsave.html%23map&data= 05%7C02%7CCedric.Govaerts%40ulb.be%7Cc52e9f7a170c41d7d6eb08dcfcefec23% 7C30a5145e75bd4212bb028ff9c0ea4ae9%7C0%7C0%7C638663354619122400%7CUnkn own%7CTWFpbGZsb3d8eyJWIjoiMC4wLjAwMDAiLCJQIjoiV2luMzIiLCJBTiI6Ik1haWwi LCJXVCI6Mn0%3D%7C0%7C%7C%7C&sdata=XrQ8DoqkPDwbeBgAURJ05pbAFOAKVGcjooXa M4EBpQ8%3D&reserved=0>
Similarly, the "mlp" command (lipophilicity coloring) also has a "map true" option: <https://rbv/ i.ucsf.edu%2Fchimerax%2Fdocs%2Fuser%2Fcommands%2Fmlp.html&data=05%7C02 %7CCedric.Govaerts%40ulb.be%7Cc52e9f7a170c41d7d6eb08dcfcefec23%7C30a51 45e75bd4212bb028ff9c0ea4ae9%7C0%7C0%7C638663354619147555%7CUnknown%7CT WFpbGZsb3d8eyJWIjoiMC4wLjAwMDAiLCJQIjoiV2luMzIiLCJBTiI6Ik1haWwiLCJXVCI 6Mn0%3D%7C0%7C%7C%7C&sdata=JoZBxQDufQIPQSoJk3AbGuoHCcoqwB%2Bgal8w3NcgJ Cs%3D&reserved=0>
Again, these are just the values on a regularly spaced 3D grid and not the values on the surface of the molecule.
The only way I can think of to get the values on the surface of the molecule (which will again be very many points and very many values) is with several additional steps:
(1) with the map model still open (created with "map true" option of either command), you would need to color the surface again using the Surface Color tool (menu: Tools... Volume Data... Surface Color) <https://rbv/ i.ucsf.edu%2Fchimerax%2Fdocs%2Fuser%2Ftools%2Fsurfacecolor.html&data=0 5%7C02%7CCedric.Govaerts%40ulb.be%7Cc52e9f7a170c41d7d6eb08dcfcefec23%7 C30a5145e75bd4212bb028ff9c0ea4ae9%7C0%7C0%7C638663354619167877%7CUnkno wn%7CTWFpbGZsb3d8eyJWIjoiMC4wLjAwMDAiLCJQIjoiV2luMzIiLCJBTiI6Ik1haWwiL CJXVCI6Mn0%3D%7C0%7C%7C%7C&sdata=W4myoEV91N0vngoFL%2FGVAHcH0D31WH0Oboc DgIJRYxQ%3D&reserved=0> (2) in that tool, of course you need to color the molecular surface of interest by that map model (3) in that tool, click Options and turn on "Report value at mouse position" .... and that will give a pop-up balloon reporting the value at the surface point where you put the mouse. Of course, that is only one point and there are probably thousands on your molecular surface.
<https://mai/ l.cgl.ucsf.edu%2Fmailman%2Farchives%2Flist%2Fchimerax-users%40cgl.ucsf .edu%2Fmessage%2FDC7U2AFCJEYNE4QFXWOI6ZX4MYXD435A%2F&data=05%7C02%7CCe dric.Govaerts%40ulb.be%7Cc52e9f7a170c41d7d6eb08dcfcefec23%7C30a5145e75 bd4212bb028ff9c0ea4ae9%7C0%7C0%7C638663354619186080%7CUnknown%7CTWFpbG Zsb3d8eyJWIjoiMC4wLjAwMDAiLCJQIjoiV2luMzIiLCJBTiI6Ik1haWwiLCJXVCI6Mn0% 3D%7C0%7C%7C%7C&sdata=7fZPGej8vZInLyB2JYeLnPh5gpiaL%2F8xg25aTRr6qhU%3D &reserved=0>
Again, the coloring you got in the first place (without using Surface Color) is the best way to understand the distribution of values on the surface.
I hope this clarifies the situation, Elaine ----- Elaine C. Meng, Ph.D. UCSF Chimera(X) team Resource for Biocomputing, Visualization, and Informatics Department of Pharmaceutical Chemistry University of California, San Francisco
On Nov 2, 2024, at 10:12 PM, mishra.ananya.163--- via ChimeraX-users <chimerax-users@cgl.ucsf.edu> wrote:
Dear Sir/Madam,
I hope this message finds you well.
My name is Ananya, and I am an undergraduate student working on a project analysing protein structures. I am currently exploring the tools available in ChimeraX to measure structural parameters of protein models. I find the visualization features for surface electrostatic potential and molecular lipophilicity potential especially valuable for my research, as they provide essential insights for my analyses.
However, I have encountered some difficulty in locating a way to export quantitative values for these surface properties. Could you please advise if there is a method within ChimeraX to generate and export these values?
Thank you for your time and I would greatly appreciate any guidance you could offer. Hope you have a great day ahead!
Best regards, Ananya
_______________________________________________ ChimeraX-users mailing list -- chimerax-users@cgl.ucsf.edu To unsubscribe send an email to chimerax-users-leave@cgl.ucsf.edu Archives: https://mail/ .cgl.ucsf.edu%2Fmailman%2Farchives%2Flist%2Fchimerax-users%40cgl.ucsf. edu%2F&data=05%7C02%7CCedric.Govaerts%40ulb.be%7Cc52e9f7a170c41d7d6eb0 8dcfcefec23%7C30a5145e75bd4212bb028ff9c0ea4ae9%7C0%7C0%7C6386633546192 04282%7CUnknown%7CTWFpbGZsb3d8eyJWIjoiMC4wLjAwMDAiLCJQIjoiV2luMzIiLCJB TiI6Ik1haWwiLCJXVCI6Mn0%3D%7C0%7C%7C%7C&sdata=gPpbVEW8Jkn40tO%2FUgibbS hvNh3wC7GlzFgeeXIWSvk%3D&reserved=0
Hi Cedric, Actually it *is* in the original PDB (or mmCIF) information. There are individual helices and individual strands: helix 1, helix 2, etc. See for example our summary of the lines in a PDB file: <https://rbvi.ucsf.edu/chimerax/docs/user/formats/pdbintro.html#secondary> The only time Chimera(X) tries to figure it out is when the file doesn't have any secondary structure assignments in it, such as when somebody created their own PDB file rather than getting it from the databank. I hope this helps, Elaine
On Nov 5, 2024, at 3:13 PM, GOVAERTS Cédric via ChimeraX-users <chimerax-users@cgl.ucsf.edu> wrote:
Hi Elaine,
Thanks (once more!) One follow up question : how does Chimera establish the ss_id to start with? As far as I know this was not present in the original PDB so why where there different segments in the structure ?
Thanks
Cedrc
-----Original Message----- From: Elaine Meng <meng@cgl.ucsf.edu> Sent: Monday, 4 November 2024 17:44 To: GOVAERTS Cédric <Cedric.Govaerts@ulb.be> Cc: ChimeraX Users Help <chimerax-users@cgl.ucsf.edu> Subject: Re: ChimeraX not accepting SS assignment
Hi Cedric, ChimeraX is accepting the SS assignment, but.... In addition to secondary structure assignment, there is another attribute that indicates whether the residues are in the same secondary structure segment as each other -- for example there could be two strands immediately next to each other (which shows a connecting thin part no matter what) that is not the same as having one long strand (which would not show any thin part).
See residue attribute "ss_id" in addition to "ss_type": <https://rbvi.ucsf.edu/chimerax/docs/user/attributes.html#residue>
So if you want a longer set of residues to be all in the same strand (or in the same helix, same issue), you would have to also tell ChimeraX they are part of the same element by assigning them the same "ss_id" value. You can just give it some high number just to make sure it isn't the same ID as some other secondary structure element in the structure, for example:
setattr /A:10-25 res ss_id 99
setattr command <https://rbvi.ucsf.edu/chimerax/docs/user/commands/setattr.html>
See also previous posts <https://mail.cgl.ucsf.edu/mailman/archives/list/chimerax-users@cgl.ucsf.edu/...> <https://mail.cgl.ucsf.edu/mailman/archives/list/chimerax-users@cgl.ucsf.edu/...>
I hope this helps, Elaine ----- Elaine C. Meng, Ph.D. UCSF Chimera(X) team Resource for Biocomputing, Visualization, and Informatics Department of Pharmaceutical Chemistry University of California, San Francisco
On Nov 4, 2024, at 4:49 AM, GOVAERTS Cédric <Cedric.Govaerts@ulb.be> wrote:
Hi Team, I want to define the secondary structure assignment on an immunoglobulin domain (C chain) using setattr /C:some-selection res ss_type 2 However ChimeraX refuses to represent a few residues within the selection as strands. This is also the case if, for instance, if I try setattr /C: res ss_type 2 Most residues are shown as strands (even some which clearly are coiled, see below, the loops) but *some* residues are still shown as coiled (even inside a strand).<image001.png> Any reason for this ? Can I overcome it ? Thanks a lot Cedric Prof. Cedric Govaerts, Ph.D. Universite Libre de Bruxelles Campus Plaine. Phone :+32 2 650 53 77 Building BC, Room 1C4 203 Boulevard du Triomphe, Acces 2 1050 Brussels Belgium http://govaertslab.ulb.ac.be/
Dear Elaine, Thank you very much for your clear and thorough response! I appreciate your explanation that the electrostatic potential map in ChimeraX is best interpreted through surface coloring. Given this, I was wondering if you might recommend any other software that is more suitable for generating quantitative values for surface electrostatic potential within specified regions of a protein. My project focuses on investigating how mutations in certain proteins affect their physical properties, including surface electrostatic potential. Access to such quantitative data would be incredibly valuable for my analysis. Thank you again for your guidance and any advice you might have. Wishing you a wonderful day ahead! Warm regards, Ananya
Hi Elaine, Well, this is a structure I (indeed) solved and no SS information was provided. I understand that ChimeraX first assigned secondary structure element (I guess using DSSP or similar) and then assigned segment ids based on this SS assignment. Forcing the ss_is number (setattr /C res ss_id 99) does indeed overwrite that. Best Cedric Prof. Cedric Govaerts, Ph.D. Universite Libre de Bruxelles Campus Plaine. Phone :+32 2 650 53 77<tel:+3226505377> Building BC, Room 1C4 203 Boulevard du Triomphe, Acces 2 1050 Brussels Belgium http://govaertslab.ulb.ac.be/ From: Elaine Meng <meng@cgl.ucsf.edu> Date: Wednesday, 6 November 2024 at 00:24 To: GOVAERTS Cédric <Cedric.Govaerts@ulb.be> Cc: ChimeraX Users Help <chimerax-users@cgl.ucsf.edu> Subject: Re: [chimerax-users] ChimeraX not accepting SS assignment Hi Cedric, Actually it *is* in the original PDB (or mmCIF) information. There are individual helices and individual strands: helix 1, helix 2, etc. See for example our summary of the lines in a PDB file: <https://eur01.safelinks.protection.outlook.com/?url=https%3A%2F%2Frbvi.ucsf.edu%2Fchimerax%2Fdocs%2Fuser%2Fformats%2Fpdbintro.html%23secondary&data=05%7C02%7CCedric.Govaerts%40ulb.be%7Cb599f319472348f4c5f608dcfdf105ff%7C30a5145e75bd4212bb028ff9c0ea4ae9%7C0%7C0%7C638664458912179551%7CUnknown%7CTWFpbGZsb3d8eyJWIjoiMC4wLjAwMDAiLCJQIjoiV2luMzIiLCJBTiI6Ik1haWwiLCJXVCI6Mn0%3D%7C0%7C%7C%7C&sdata=YtxoacnZaD11edQLMgfziw6rbtb%2FafiYXbaNqVfZkfQ%3D&reserved=0<https://rbvi.ucsf.edu/chimerax/docs/user/formats/pdbintro.html#secondary>> The only time Chimera(X) tries to figure it out is when the file doesn't have any secondary structure assignments in it, such as when somebody created their own PDB file rather than getting it from the databank. I hope this helps, Elaine
On Nov 5, 2024, at 3:13 PM, GOVAERTS Cédric via ChimeraX-users <chimerax-users@cgl.ucsf.edu> wrote:
Hi Elaine,
Thanks (once more!) One follow up question : how does Chimera establish the ss_id to start with? As far as I know this was not present in the original PDB so why where there different segments in the structure ?
Thanks
Cedrc
-----Original Message----- From: Elaine Meng <meng@cgl.ucsf.edu> Sent: Monday, 4 November 2024 17:44 To: GOVAERTS Cédric <Cedric.Govaerts@ulb.be> Cc: ChimeraX Users Help <chimerax-users@cgl.ucsf.edu> Subject: Re: ChimeraX not accepting SS assignment
Hi Cedric, ChimeraX is accepting the SS assignment, but.... In addition to secondary structure assignment, there is another attribute that indicates whether the residues are in the same secondary structure segment as each other -- for example there could be two strands immediately next to each other (which shows a connecting thin part no matter what) that is not the same as having one long strand (which would not show any thin part).
See residue attribute "ss_id" in addition to "ss_type": <https://eur01.safelinks.protection.outlook.com/?url=https%3A%2F%2Frbvi.ucsf.edu%2Fchimerax%2Fdocs%2Fuser%2Fattributes.html%23residue&data=05%7C02%7CCedric.Govaerts%40ulb.be%7Cb599f319472348f4c5f608dcfdf105ff%7C30a5145e75bd4212bb028ff9c0ea4ae9%7C0%7C0%7C638664458912205300%7CUnknown%7CTWFpbGZsb3d8eyJWIjoiMC4wLjAwMDAiLCJQIjoiV2luMzIiLCJBTiI6Ik1haWwiLCJXVCI6Mn0%3D%7C0%7C%7C%7C&sdata=WCSiZj%2BIvQNU86Xs6zDWzs71Y5JJc3axf52Dd0DpxXY%3D&reserved=0<https://rbvi.ucsf.edu/chimerax/docs/user/attributes.html#residue>>
So if you want a longer set of residues to be all in the same strand (or in the same helix, same issue), you would have to also tell ChimeraX they are part of the same element by assigning them the same "ss_id" value. You can just give it some high number just to make sure it isn't the same ID as some other secondary structure element in the structure, for example:
setattr /A:10-25 res ss_id 99
See also previous posts <https://eur01.safelinks.protection.outlook.com/?url=https%3A%2F%2Fmail.cgl.ucsf.edu%2Fmailman%2Farchives%2Flist%2Fchimerax-users%40cgl.ucsf.edu%2Fmessage%2FP34Q6R2R3VOGGII7COZE6NWH6K4Q6OE3%2F&data=05%7C02%7CCedric.Govaerts%40ulb.be%7Cb599f319472348f4c5f608dcfdf105ff%7C30a5145e75bd4212bb028ff9c0ea4ae9%7C0%7C0%7C638664458912236583%7CUnknown%7CTWFpbGZsb3d8eyJWIjoiMC4wLjAwMDAiLCJQIjoiV2luMzIiLCJBTiI6Ik1haWwiLCJXVCI6Mn0%3D%7C0%7C%7C%7C&sdata=2vdQtZ%2FHQW%2Fq0k58J5BSGJsnEE9QdsjZDw79sifcAFo%3D&reserved=0<https://mail.cgl.ucsf.edu/mailman/archives/list/chimerax-users@cgl.ucsf.edu/message/P34Q6R2R3VOGGII7COZE6NWH6K4Q6OE3/>> <https://eur01.safelinks.protection.outlook.com/?url=https%3A%2F%2Fmail.cgl.ucsf.edu%2Fmailman%2Farchives%2Flist%2Fchimerax-users%40cgl.ucsf.edu%2Fmessage%2FAQYXJULBOURU63YPEE735T43IYHO3B5I%2F&data=05%7C02%7CCedric.Govaerts%40ulb.be%7Cb599f319472348f4c5f608dcfdf105ff%7C30a5145e75bd4212bb028ff9c0ea4ae9%7C0%7C0%7C638664458912252022%7CUnknown%7CTWFpbGZsb3d8eyJWIjoiMC4wLjAwMDAiLCJQIjoiV2luMzIiLCJBTiI6Ik1haWwiLCJXVCI6Mn0%3D%7C0%7C%7C%7C&sdata=j9TljTnwIAX45F0M1tWQ9JuZgzmG57i2mmXMuiqPMp8%3D&reserved=0<https://mail.cgl.ucsf.edu/mailman/archives/list/chimerax-users@cgl.ucsf.edu/message/AQYXJULBOURU63YPEE735T43IYHO3B5I/>>
I hope this helps, Elaine ----- Elaine C. Meng, Ph.D. UCSF Chimera(X) team Resource for Biocomputing, Visualization, and Informatics Department of Pharmaceutical Chemistry University of California, San Francisco
On Nov 4, 2024, at 4:49 AM, GOVAERTS Cédric <Cedric.Govaerts@ulb.be> wrote:
Hi Team, I want to define the secondary structure assignment on an immunoglobulin domain (C chain) using setattr /C:some-selection res ss_type 2 However ChimeraX refuses to represent a few residues within the selection as strands. This is also the case if, for instance, if I try setattr /C: res ss_type 2 Most residues are shown as strands (even some which clearly are coiled, see below, the loops) but *some* residues are still shown as coiled (even inside a strand).<image001.png> Any reason for this ? Can I overcome it ? Thanks a lot Cedric Prof. Cedric Govaerts, Ph.D. Universite Libre de Bruxelles Campus Plaine. Phone :+32 2 650 53 77 Building BC, Room 1C4 203 Boulevard du Triomphe, Acces 2 1050 Brussels Belgium https://eur01.safelinks.protection.outlook.com/?url=http%3A%2F%2Fgovaertslab.ulb.ac.be%2F&data=05%7C02%7CCedric.Govaerts%40ulb.be%7Cb599f319472348f4c5f608dcfdf105ff%7C30a5145e75bd4212bb028ff9c0ea4ae9%7C0%7C0%7C638664458912268571%7CUnknown%7CTWFpbGZsb3d8eyJWIjoiMC4wLjAwMDAiLCJQIjoiV2luMzIiLCJBTiI6Ik1haWwiLCJXVCI6Mn0%3D%7C0%7C%7C%7C&sdata=zE0%2BbIG7gD3lR2yBY8pcfSx6Y1ly5pXCg9fiQMFHit8%3D&reserved=0<http://govaertslab.ulb.ac.be/>
There are other programs that calculate electrostatic potential in a more quantitative manner (APBS, DelPhi, others), but they also all give a big 3D grid of many points and are normally used for visual analysis by coloring molecular surfaces. So usually people show the electrostatic effect of some mutation by side-by-side image comparison of the coloring of the mutated protein next to the coloring of the wild-type protein, which you could also do with ChimeraX. I don't know if you are trying to get some single number that tells you something, but that is not how "potential" exists -- it is a 3D spatially varying quantity. Elaine
On Nov 5, 2024, at 6:03 PM, mishra.ananya.163--- via ChimeraX-users <chimerax-users@cgl.ucsf.edu> wrote:
Dear Elaine,
Thank you very much for your clear and thorough response!
I appreciate your explanation that the electrostatic potential map in ChimeraX is best interpreted through surface coloring. Given this, I was wondering if you might recommend any other software that is more suitable for generating quantitative values for surface electrostatic potential within specified regions of a protein.
My project focuses on investigating how mutations in certain proteins affect their physical properties, including surface electrostatic potential. Access to such quantitative data would be incredibly valuable for my analysis.
Thank you again for your guidance and any advice you might have. Wishing you a wonderful day ahead!
Warm regards, Ananya _______________________________________________ ChimeraX-users mailing list -- chimerax-users@cgl.ucsf.edu To unsubscribe send an email to chimerax-users-leave@cgl.ucsf.edu Archives: https://mail.cgl.ucsf.edu/mailman/archives/list/chimerax-users@cgl.ucsf.edu/
participants (3)
-
 Elaine Meng
 -
 GOVAERTS Cédric
 -
 mishra.ananya.163@gmail.com