segmented tomogram density in chimeraX

hi all, I have segmented a tomogram in Amira and exported to chimera for visualization. I first opened the .rec file in chimera and re-saved as .mrc. Okay, the segmentation output gives a fully filled volume cube except for the regions of segmentation. Obviously things are inverted. Also, the volume viewer shows clear sharp peaks (delta functions) rather than continuous density, as volume slider moves to the right new segmentation features appear. So I used volume filter with "scale" to -1, and I turned off "displayed subregions only". This fixed the inversion problem and now as I slide toward the right I see more segmented densities. However the threshold values are all negative (-250 on the far left to -240 on the far right). This, combined with the densities being sharp peaks, makes it impossible to use this volume like a regular volume for surface coloring, filtering, segger, etc. Any suggestion on how to go from this step to a usable density would be appreciated. thanks! Jesse ================================= Dr. Jesse Hansen Schur Group Institute of Science and Technology Austria Am Campus 1 3400 Klosterneuburg Austria

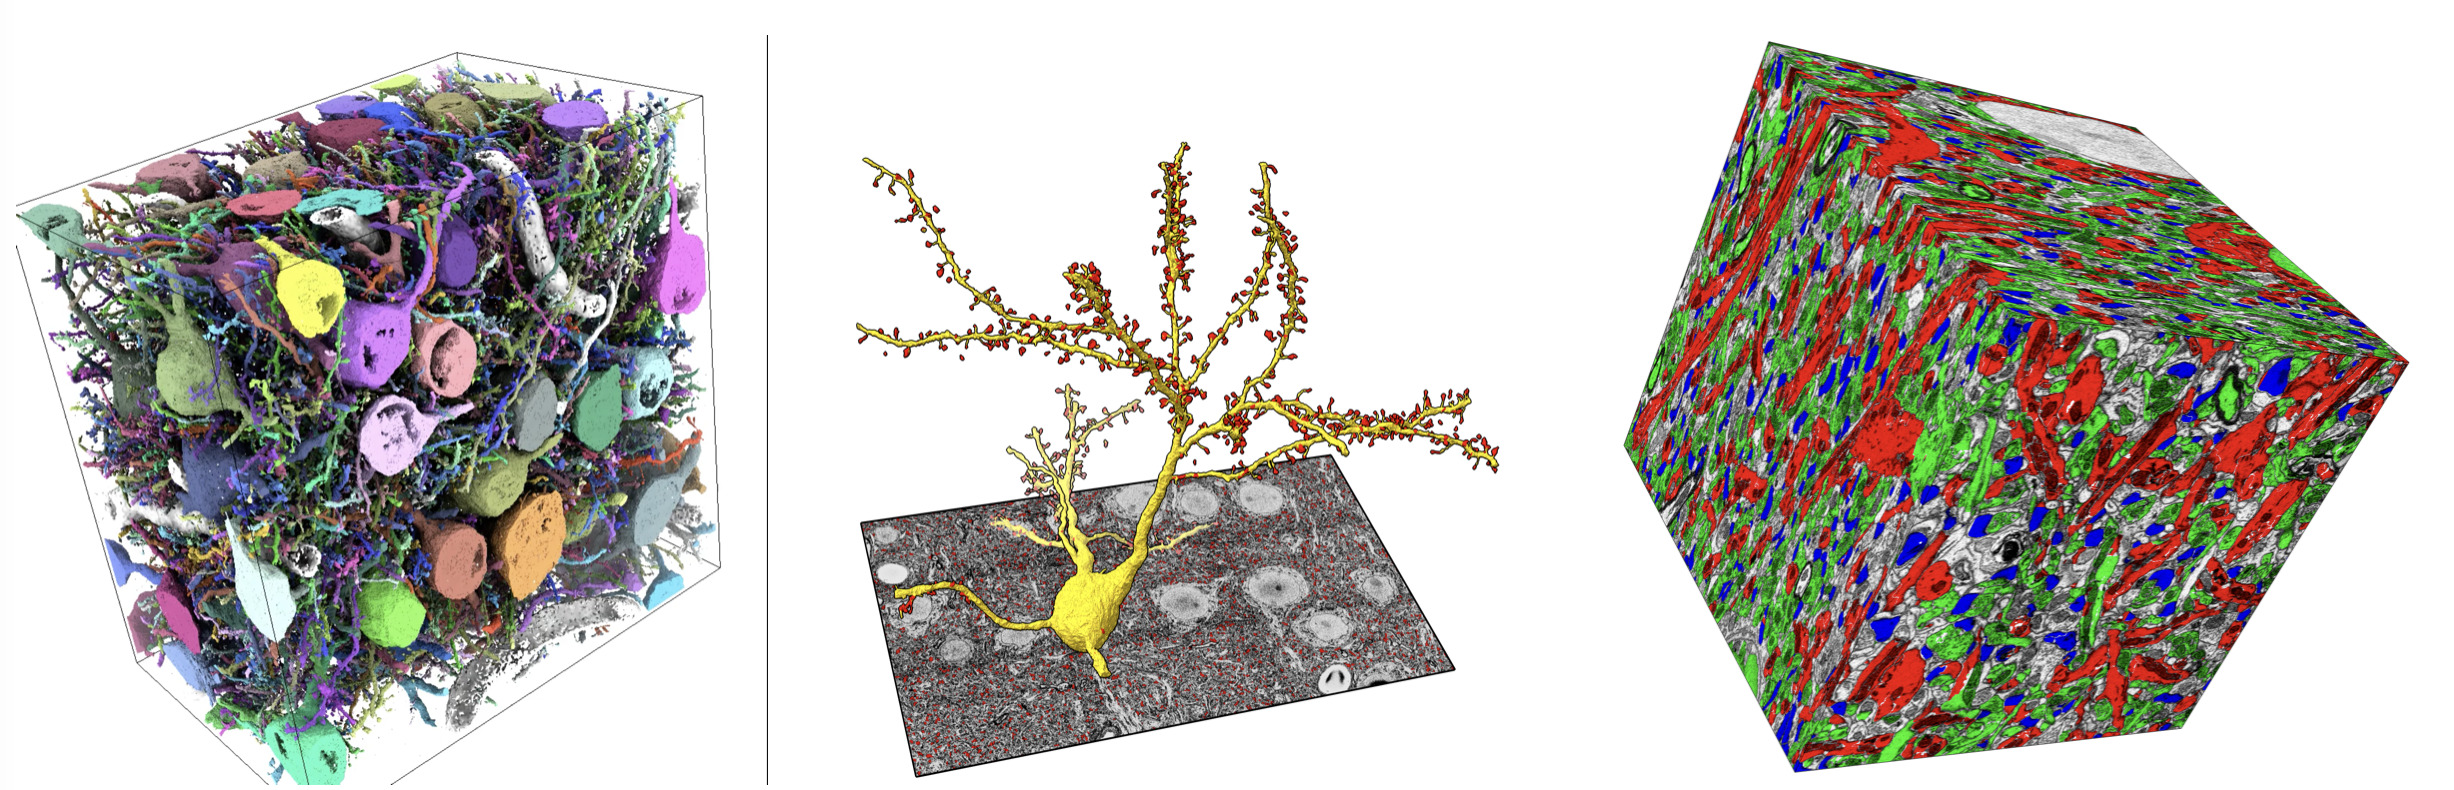
Hi Jesse, I guess your segmentation has assigned an integer region number to each grid point. It sounds like those region numbers range from 240 to 250. Displaying that as if is a density map with contour surfaces isn't very useful as you point out. Instead you can use the ChimeraX segmentation command to make a surface for each region, for example segmentation surface #1 each segment where "#1" is the id of the segmentation model you opened, and the "each segment" part says to make a separate surface for each region instead of one surface that includes all regions, Documentation is here https://www.cgl.ucsf.edu/chimerax/docs/user/commands/segmentation.html <https://www.cgl.ucsf.edu/chimerax/docs/user/commands/segmentation.html> You can also color your tomogram using the segmented regions using the "segmentation color" command. There are examples of both commands for segmented neurons in a rat brain here https://www.rbvi.ucsf.edu/chimerax/data/layer4-june2020/mousebrain.html <https://www.rbvi.ucsf.edu/chimerax/data/layer4-june2020/mousebrain.html> This example is a bit fancier than your data in that multiple attributes are associated with each region of the segmentation. Tom
On Oct 24, 2022, at 6:46 AM, Jesse HANSEN via ChimeraX-users <chimerax-users@cgl.ucsf.edu> wrote:
hi all,
I have segmented a tomogram in Amira and exported to chimera for visualization. I first opened the .rec file in chimera and re-saved as .mrc. Okay, the segmentation output gives a fully filled volume cube except for the regions of segmentation. Obviously things are inverted. Also, the volume viewer shows clear sharp peaks (delta functions) rather than continuous density, as volume slider moves to the right new segmentation features appear. So I used volume filter with "scale" to -1, and I turned off "displayed subregions only". This fixed the inversion problem and now as I slide toward the right I see more segmented densities. However the threshold values are all negative (-250 on the far left to -240 on the far right). This, combined with the densities being sharp peaks, makes it impossible to use this volume like a regular volume for surface coloring, filtering, segger, etc. Any suggestion on how to go from this step to a usable density would be appreciated.
thanks! Jesse ================================= Dr. Jesse Hansen Schur Group Institute of Science and Technology Austria Am Campus 1 3400 Klosterneuburg Austria _______________________________________________ ChimeraX-users mailing list ChimeraX-users@cgl.ucsf.edu <mailto:ChimeraX-users@cgl.ucsf.edu> Manage subscription: https://www.rbvi.ucsf.edu/mailman/listinfo/chimerax-users <https://www.rbvi.ucsf.edu/mailman/listinfo/chimerax-users>
hi, thank you, this is a very helpful response! Using segmentation surface #1 each segment I indeed did get all of the surfaces segmented. The problem though is that the segmentation was not very smooth so I'd like to now smooth the surfaces in chimeraX. As a workaround to directly smoothing the surface, I used segmentation color to color the tomogram volume, which seems to have colored as expected. then I tried "volume splitbyzone #1.2" (for tomogram #1 it has by default #1.1 for surface and #1.2 for image(volume)). This appears to have executed but I do not get any output sub-volumes separated by color. thanks again Jesse ________________________________ From: Tom Goddard <goddard@sonic.net> Sent: Monday, October 24, 2022 8:32:35 PM To: Jesse HANSEN Cc: chimerax-users@cgl.ucsf.edu Subject: Re: [chimerax-users] segmented tomogram density in chimeraX Hi Jesse, I guess your segmentation has assigned an integer region number to each grid point. It sounds like those region numbers range from 240 to 250. Displaying that as if is a density map with contour surfaces isn't very useful as you point out. Instead you can use the ChimeraX segmentation command to make a surface for each region, for example segmentation surface #1 each segment where "#1" is the id of the segmentation model you opened, and the "each segment" part says to make a separate surface for each region instead of one surface that includes all regions, Documentation is here https://www.cgl.ucsf.edu/chimerax/docs/user/commands/segmentation.html You can also color your tomogram using the segmented regions using the "segmentation color" command. There are examples of both commands for segmented neurons in a rat brain here https://www.rbvi.ucsf.edu/chimerax/data/layer4-june2020/mousebrain.html This example is a bit fancier than your data in that multiple attributes are associated with each region of the segmentation. Tom [cid:D0AF92C8-D3D5-402F-84FE-45B0BBB05889] On Oct 24, 2022, at 6:46 AM, Jesse HANSEN via ChimeraX-users <chimerax-users@cgl.ucsf.edu<mailto:chimerax-users@cgl.ucsf.edu>> wrote: hi all, I have segmented a tomogram in Amira and exported to chimera for visualization. I first opened the .rec file in chimera and re-saved as .mrc. Okay, the segmentation output gives a fully filled volume cube except for the regions of segmentation. Obviously things are inverted. Also, the volume viewer shows clear sharp peaks (delta functions) rather than continuous density, as volume slider moves to the right new segmentation features appear. So I used volume filter with "scale" to -1, and I turned off "displayed subregions only". This fixed the inversion problem and now as I slide toward the right I see more segmented densities. However the threshold values are all negative (-250 on the far left to -240 on the far right). This, combined with the densities being sharp peaks, makes it impossible to use this volume like a regular volume for surface coloring, filtering, segger, etc. Any suggestion on how to go from this step to a usable density would be appreciated. thanks! Jesse ================================= Dr. Jesse Hansen Schur Group Institute of Science and Technology Austria Am Campus 1 3400 Klosterneuburg Austria _______________________________________________ ChimeraX-users mailing list ChimeraX-users@cgl.ucsf.edu<mailto:ChimeraX-users@cgl.ucsf.edu> Manage subscription: https://www.rbvi.ucsf.edu/mailman/listinfo/chimerax-users

Hi Jesse, The split-by-zone feature applies after you have colored a single map isosurface to match colored atoms. If I understood correctly, you did a segmentation which produces separate surfaces, each with their own colors. If the segmentation was done with Segment Map (Segger) in ChimeraX, then you could use the Segment Map tool's File menu to save each segmented map region to a separate map file. However, your workflow involved segmentation before reading into ChimeraX, so I am not completely sure how you would do it. If you have separate segmentation surface models (i.e. listed separately in the Model Panel) and you want to generate maps of only the part of the volume inside each surface, maybe you can do it with a "volume mask" command for each surface. See <https://rbvi.ucsf.edu/chimerax/docs/user/commands/volume.html#mask> I hope this helps, Elaine ----- Elaine C. Meng, Ph.D. UCSF Chimera(X) team Department of Pharmaceutical Chemistry University of California, San Francisco
On Oct 25, 2022, at 12:29 AM, Jesse HANSEN via ChimeraX-users <chimerax-users@cgl.ucsf.edu> wrote:
hi, thank you, this is a very helpful response! Using segmentation surface #1 each segment I indeed did get all of the surfaces segmented. The problem though is that the segmentation was not very smooth so I'd like to now smooth the surfaces in chimeraX.
As a workaround to directly smoothing the surface, I used segmentation color to color the tomogram volume, which seems to have colored as expected. then I tried "volume splitbyzone #1.2" (for tomogram #1 it has by default #1.1 for surface and #1.2 for image(volume)). This appears to have executed but I do not get any output sub-volumes separated by color.
thanks again
Jesse
From: Tom Goddard <goddard@sonic.net> Sent: Monday, October 24, 2022 8:32:35 PM To: Jesse HANSEN Cc: chimerax-users@cgl.ucsf.edu Subject: Re: [chimerax-users] segmented tomogram density in chimeraX
Hi Jesse,
I guess your segmentation has assigned an integer region number to each grid point. It sounds like those region numbers range from 240 to 250. Displaying that as if is a density map with contour surfaces isn't very useful as you point out. Instead you can use the ChimeraX segmentation command to make a surface for each region, for example
segmentation surface #1 each segment
where "#1" is the id of the segmentation model you opened, and the "each segment" part says to make a separate surface for each region instead of one surface that includes all regions, Documentation is here
https://www.cgl.ucsf.edu/chimerax/docs/user/commands/segmentation.html
You can also color your tomogram using the segmented regions using the "segmentation color" command. There are examples of both commands for segmented neurons in a rat brain here
https://www.rbvi.ucsf.edu/chimerax/data/layer4-june2020/mousebrain.html
This example is a bit fancier than your data in that multiple attributes are associated with each region of the segmentation.
Tom
<segmentation.jpg>
On Oct 24, 2022, at 6:46 AM, Jesse HANSEN via ChimeraX-users <chimerax-users@cgl.ucsf.edu> wrote:
hi all,
I have segmented a tomogram in Amira and exported to chimera for visualization. I first opened the .rec file in chimera and re-saved as .mrc. Okay, the segmentation output gives a fully filled volume cube except for the regions of segmentation. Obviously things are inverted. Also, the volume viewer shows clear sharp peaks (delta functions) rather than continuous density, as volume slider moves to the right new segmentation features appear. So I used volume filter with "scale" to -1, and I turned off "displayed subregions only". This fixed the inversion problem and now as I slide toward the right I see more segmented densities. However the threshold values are all negative (-250 on the far left to -240 on the far right). This, combined with the densities being sharp peaks, makes it impossible to use this volume like a regular volume for surface coloring, filtering, segger, etc. Any suggestion on how to go from this step to a usable density would be appreciated.
thanks! Jesse
Hi Jesse, The segmentation surfaces are not very smooth because they are just contour surfaces on the one/zero mask so they show stair steps. I've added an option to the "segmentation surfaces" command to smooth those surfaces, in tomorrow's ChimeraX daily build and 1.5 release candidate. segmentation surfaces #1 smooth true Tom Unsmoothed versus smoothed segmentation surfaces
On Oct 25, 2022, at 12:29 AM, Jesse HANSEN <jesse.hansen@ist.ac.at> wrote:
hi, thank you, this is a very helpful response! Using segmentation surface #1 each segment I indeed did get all of the surfaces segmented. The problem though is that the segmentation was not very smooth so I'd like to now smooth the surfaces in chimeraX.
As a workaround to directly smoothing the surface, I used segmentation color to color the tomogram volume, which seems to have colored as expected. then I tried "volume splitbyzone #1.2" (for tomogram #1 it has by default #1.1 for surface and #1.2 for image(volume)). This appears to have executed but I do not get any output sub-volumes separated by color.
thanks again
Jesse
From: Tom Goddard <goddard@sonic.net> Sent: Monday, October 24, 2022 8:32:35 PM To: Jesse HANSEN Cc: chimerax-users@cgl.ucsf.edu Subject: Re: [chimerax-users] segmented tomogram density in chimeraX
Hi Jesse,
I guess your segmentation has assigned an integer region number to each grid point. It sounds like those region numbers range from 240 to 250. Displaying that as if is a density map with contour surfaces isn't very useful as you point out. Instead you can use the ChimeraX segmentation command to make a surface for each region, for example
segmentation surface #1 each segment
where "#1" is the id of the segmentation model you opened, and the "each segment" part says to make a separate surface for each region instead of one surface that includes all regions, Documentation is here
https://www.cgl.ucsf.edu/chimerax/docs/user/commands/segmentation.html <https://www.cgl.ucsf.edu/chimerax/docs/user/commands/segmentation.html>
You can also color your tomogram using the segmented regions using the "segmentation color" command. There are examples of both commands for segmented neurons in a rat brain here
https://www.rbvi.ucsf.edu/chimerax/data/layer4-june2020/mousebrain.html <https://www.rbvi.ucsf.edu/chimerax/data/layer4-june2020/mousebrain.html>
This example is a bit fancier than your data in that multiple attributes are associated with each region of the segmentation.
Tom
<segmentation.jpg>
On Oct 24, 2022, at 6:46 AM, Jesse HANSEN via ChimeraX-users <chimerax-users@cgl.ucsf.edu <mailto:chimerax-users@cgl.ucsf.edu>> wrote:
hi all,
I have segmented a tomogram in Amira and exported to chimera for visualization. I first opened the .rec file in chimera and re-saved as .mrc. Okay, the segmentation output gives a fully filled volume cube except for the regions of segmentation. Obviously things are inverted. Also, the volume viewer shows clear sharp peaks (delta functions) rather than continuous density, as volume slider moves to the right new segmentation features appear. So I used volume filter with "scale" to -1, and I turned off "displayed subregions only". This fixed the inversion problem and now as I slide toward the right I see more segmented densities. However the threshold values are all negative (-250 on the far left to -240 on the far right). This, combined with the densities being sharp peaks, makes it impossible to use this volume like a regular volume for surface coloring, filtering, segger, etc. Any suggestion on how to go from this step to a usable density would be appreciated.
thanks! Jesse ================================= Dr. Jesse Hansen Schur Group Institute of Science and Technology Austria Am Campus 1 3400 Klosterneuburg Austria _______________________________________________ ChimeraX-users mailing list ChimeraX-users@cgl.ucsf.edu <mailto:ChimeraX-users@cgl.ucsf.edu> Manage subscription: https://www.rbvi.ucsf.edu/mailman/listinfo/chimerax-users <https://www.rbvi.ucsf.edu/mailman/listinfo/chimerax-users>
participants (3)
-
 Elaine Meng
 -
 Jesse HANSEN
 -
 Tom Goddard