
Continuing my earlier question. I tried the suggestions sent to me neither split nor surfcat seemed to work. After some attempts I received this window and reported the bug [cid:image001.png@01D2CD74.26A7D780] I then tried to use molmap and I did get a surface and saw how by moving the cursor in the molmap window I could get the surface to progressively disappear leaving the selected domains that were colored previously. The surface was for the entire protein, one of the models #0. I could also change the surface color. Then I went looking at some of the tabs on the molmap window and cannot describe the sequence, but ended up with another window that I eventually found out was for visualizing Cryo EM maps. Now I have a surface that is multicolored and looks like jelly beans. Somehow perhaps by selecting one of the models from the command lines, (#0) I was able to pull out a surface of the entire molecule, rotate it etc, and progressively remove the surface, til the selected domains remained. Stuck!!! This is one model: [cid:image003.png@01D2CD79.3D09E040] [cid:image004.jpg@01D2CD79.3D09E040] HERE IS ANOTHER which is #1 or #2 [cid:image005.jpg@01D2CD79.3D09E040] [cid:image006.png@01D2CD79.3D09E040] Arthur Szabo

Hi Arthur, The “molmap” command creates a surface by first simulating a denstiy map from the atom coordinates and then showing an isosurface of that “density.” That is why the Volume Viewer dialog for viewing density maps automatically pops up. When you say you move the cursor in the “molmap window” what you are really doing is changing the isosurface contour level in the Volume Viewer dialog. Otherwise I have no idea what you have done, or even what your question is, sorry. Elaine ---------- Elaine C. Meng, Ph.D. UCSF Computer Graphics Lab (Chimera team) and Babbitt Lab Department of Pharmaceutical Chemistry University of California, San Francisco
On May 15, 2017, at 9:46 AM, Arthur Szabo <agszabo@outlook.com> wrote:
Continuing my earlier question.
I tried the suggestions sent to me neither split nor surfcat seemed to work.
After some attempts I received this window and reported the bug
<image001.png>
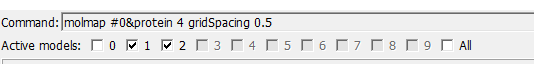
I then tried to use molmap and I did get a surface and saw how by moving the cursor in the molmap window I could get the surface to progressively disappear leaving the selected domains that were colored previously. The surface was for the entire protein, one of the models #0.
I could also change the surface color.
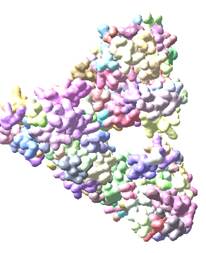
Then I went looking at some of the tabs on the molmap window and cannot describe the sequence, but ended up with another window that I eventually found out was for visualizing Cryo EM maps. Now I have a surface that is multicolored and looks like jelly beans.
Somehow perhaps by selecting one of the models from the command lines, (#0) I was able to pull out a surface of the entire molecule, rotate it etc, and progressively remove the surface, til the selected domains remained.
Stuck!!!
This is one model:
<image003.png> <image004.jpg>
HERE IS ANOTHER which is #1 or #2
<image005.jpg>
<image006.png>
Arthur Szabo
_______________________________________________ Chimera-users mailing list: Chimera-users@cgl.ucsf.edu Manage subscription: http://plato.cgl.ucsf.edu/mailman/listinfo/chimera-users
Elaine I appreciate it is very difficult to visualize what I have been trying to do. I have tried the commands that you suggested, but without success. Just ot repeat for clarity sake, perhaps there is no way I can achieve my desired goal. I have a protein with 1200 residues, and I have been able to generate a ribbon model of three of the key domains. I would like to show these domains as surfaces rather than ribbon diagrams. I just get various error messages. No success despite my trying the suggestions that you gave to me. I may not have applied the suggestions as you indicated. Thanks for your assistance. arthur -----Original Message----- From: Elaine Meng [mailto:meng@cgl.ucsf.edu] Sent: Monday, May 15, 2017 1:12 PM To: Arthur Szabo <agszabo@outlook.com> Cc: chimera-users@cgl.ucsf.edu BB <chimera-users@cgl.ucsf.edu> Subject: Re: [Chimera-users] error or bug Hi Arthur, The “molmap” command creates a surface by first simulating a denstiy map from the atom coordinates and then showing an isosurface of that “density.” That is why the Volume Viewer dialog for viewing density maps automatically pops up. When you say you move the cursor in the “molmap window” what you are really doing is changing the isosurface contour level in the Volume Viewer dialog. Otherwise I have no idea what you have done, or even what your question is, sorry. Elaine ---------- Elaine C. Meng, Ph.D. UCSF Computer Graphics Lab (Chimera team) and Babbitt Lab Department of Pharmaceutical Chemistry University of California, San Francisco
On May 15, 2017, at 9:46 AM, Arthur Szabo <agszabo@outlook.com> wrote:
Continuing my earlier question.
I tried the suggestions sent to me neither split nor surfcat seemed to work.
After some attempts I received this window and reported the bug
<image001.png>
I then tried to use molmap and I did get a surface and saw how by moving the cursor in the molmap window I could get the surface to progressively disappear leaving the selected domains that were colored previously. The surface was for the entire protein, one of the models #0.
I could also change the surface color.
Then I went looking at some of the tabs on the molmap window and cannot describe the sequence, but ended up with another window that I eventually found out was for visualizing Cryo EM maps. Now I have a surface that is multicolored and looks like jelly beans.
Somehow perhaps by selecting one of the models from the command lines, (#0) I was able to pull out a surface of the entire molecule, rotate it etc, and progressively remove the surface, til the selected domains remained.
Stuck!!!
This is one model:
<image003.png> <image004.jpg>
HERE IS ANOTHER which is #1 or #2
<image005.jpg>
<image006.png>
Arthur Szabo
_______________________________________________ Chimera-users mailing list: Chimera-users@cgl.ucsf.edu Manage subscription: http://plato.cgl.ucsf.edu/mailman/listinfo/chimera-users
Hi Arthur, Is this structure in the PDB? If so, please tell me its ID, otherwise I can’t try anything. Thanks Elaine
On May 15, 2017, at 10:19 AM, Arthur Szabo <agszabo@outlook.com> wrote:
Elaine
I appreciate it is very difficult to visualize what I have been trying to do.
I have tried the commands that you suggested, but without success.
Just ot repeat for clarity sake, perhaps there is no way I can achieve my desired goal.
I have a protein with 1200 residues, and I have been able to generate a ribbon model of three of the key domains.
I would like to show these domains as surfaces rather than ribbon diagrams. I just get various error messages.
No success despite my trying the suggestions that you gave to me.
I may not have applied the suggestions as you indicated.
Thanks for your assistance.
arthur
-----Original Message----- From: Elaine Meng [mailto:meng@cgl.ucsf.edu] Sent: Monday, May 15, 2017 1:12 PM To: Arthur Szabo <agszabo@outlook.com> Cc: chimera-users@cgl.ucsf.edu BB <chimera-users@cgl.ucsf.edu> Subject: Re: [Chimera-users] error or bug
Hi Arthur, The “molmap” command creates a surface by first simulating a denstiy map from the atom coordinates and then showing an isosurface of that “density.” That is why the Volume Viewer dialog for viewing density maps automatically pops up. When you say you move the cursor in the “molmap window” what you are really doing is changing the isosurface contour level in the Volume Viewer dialog.
Otherwise I have no idea what you have done, or even what your question is, sorry. Elaine ---------- Elaine C. Meng, Ph.D. UCSF Computer Graphics Lab (Chimera team) and Babbitt Lab Department of Pharmaceutical Chemistry University of California, San Francisco
On May 15, 2017, at 9:46 AM, Arthur Szabo <agszabo@outlook.com> wrote:
Continuing my earlier question.
I tried the suggestions sent to me neither split nor surfcat seemed to work.
After some attempts I received this window and reported the bug
<image001.png>
I then tried to use molmap and I did get a surface and saw how by moving the cursor in the molmap window I could get the surface to progressively disappear leaving the selected domains that were colored previously. The surface was for the entire protein, one of the models #0.
I could also change the surface color.
Then I went looking at some of the tabs on the molmap window and cannot describe the sequence, but ended up with another window that I eventually found out was for visualizing Cryo EM maps. Now I have a surface that is multicolored and looks like jelly beans.
Somehow perhaps by selecting one of the models from the command lines, (#0) I was able to pull out a surface of the entire molecule, rotate it etc, and progressively remove the surface, til the selected domains remained.
Stuck!!!
This is one model:
<image003.png> <image004.jpg>
HERE IS ANOTHER which is #1 or #2
<image005.jpg>
<image006.png>
Arthur Szabo
_______________________________________________ Chimera-users mailing list: Chimera-users@cgl.ucsf.edu Manage subscription: http://plato.cgl.ucsf.edu/mailman/listinfo/chimera-users
_______________________________________________ Chimera-users mailing list: Chimera-users@cgl.ucsf.edu Manage subscription: http://plato.cgl.ucsf.edu/mailman/listinfo/chimera-users
Also please tell me what residue numbers are in the domains you want to show as separate surfaces. Thanks Elaine
On May 15, 2017, at 10:38 AM, Elaine Meng <meng@cgl.ucsf.edu> wrote:
Hi Arthur, Is this structure in the PDB? If so, please tell me its ID, otherwise I can’t try anything. Thanks Elaine
On May 15, 2017, at 10:19 AM, Arthur Szabo <agszabo@outlook.com> wrote:
Elaine
I appreciate it is very difficult to visualize what I have been trying to do.
I have tried the commands that you suggested, but without success.
Just ot repeat for clarity sake, perhaps there is no way I can achieve my desired goal.
I have a protein with 1200 residues, and I have been able to generate a ribbon model of three of the key domains.
I would like to show these domains as surfaces rather than ribbon diagrams. I just get various error messages.
No success despite my trying the suggestions that you gave to me.
I may not have applied the suggestions as you indicated.
Thanks for your assistance.
arthur
-----Original Message----- From: Elaine Meng [mailto:meng@cgl.ucsf.edu] Sent: Monday, May 15, 2017 1:12 PM To: Arthur Szabo <agszabo@outlook.com> Cc: chimera-users@cgl.ucsf.edu BB <chimera-users@cgl.ucsf.edu> Subject: Re: [Chimera-users] error or bug
Hi Arthur, The “molmap” command creates a surface by first simulating a denstiy map from the atom coordinates and then showing an isosurface of that “density.” That is why the Volume Viewer dialog for viewing density maps automatically pops up. When you say you move the cursor in the “molmap window” what you are really doing is changing the isosurface contour level in the Volume Viewer dialog.
Otherwise I have no idea what you have done, or even what your question is, sorry. Elaine ---------- Elaine C. Meng, Ph.D. UCSF Computer Graphics Lab (Chimera team) and Babbitt Lab Department of Pharmaceutical Chemistry University of California, San Francisco
On May 15, 2017, at 9:46 AM, Arthur Szabo <agszabo@outlook.com> wrote:
Continuing my earlier question.
I tried the suggestions sent to me neither split nor surfcat seemed to work.
After some attempts I received this window and reported the bug
<image001.png>
I then tried to use molmap and I did get a surface and saw how by moving the cursor in the molmap window I could get the surface to progressively disappear leaving the selected domains that were colored previously. The surface was for the entire protein, one of the models #0.
I could also change the surface color.
Then I went looking at some of the tabs on the molmap window and cannot describe the sequence, but ended up with another window that I eventually found out was for visualizing Cryo EM maps. Now I have a surface that is multicolored and looks like jelly beans.
Somehow perhaps by selecting one of the models from the command lines, (#0) I was able to pull out a surface of the entire molecule, rotate it etc, and progressively remove the surface, til the selected domains remained.
Stuck!!!
This is one model:
<image003.png> <image004.jpg>
HERE IS ANOTHER which is #1 or #2
<image005.jpg>
<image006.png>
Arthur Szabo
_______________________________________________ Chimera-users mailing list: Chimera-users@cgl.ucsf.edu Manage subscription: http://plato.cgl.ucsf.edu/mailman/listinfo/chimera-users
_______________________________________________ Chimera-users mailing list: Chimera-users@cgl.ucsf.edu Manage subscription: http://plato.cgl.ucsf.edu/mailman/listinfo/chimera-users
_______________________________________________ Chimera-users mailing list: Chimera-users@cgl.ucsf.edu Manage subscription: http://plato.cgl.ucsf.edu/mailman/listinfo/chimera-users
participants (2)
-
 Arthur Szabo
 -
 Elaine Meng